


1. Initial understanding
At this stage, we need to understand some concepts and terminology, so as to avoid making mistakes in front of our seniors, such as:
Q: What is the difference between RT-PCR, qPCR, Real-time PCR, and real-time RT-PCR?
Answer: RT-PCR is reverse transcription PCR (reverse transcription PCR, RT-PCR), which is a widely used variant of polymerase chain reaction (PCR). In RT-PCR, an RNA strand is reverse transcribed into complementary DNA, which is then used as a template for DNA amplification by PCR.
Real-time-PCR and qPCR (Quantitative Rea-ltime-PCR) are the same thing, both are real-time quantitative PCR, which means that each cycle of PCR has real-time data records, so the number of starting templates can be adjusted precise analysis.
Although both Real-time PCR (real-time fluorescent quantitative PCR) and Reverse transcription PCR (reverse transcription PCR) seem to be abbreviated as RT-PCR, the international convention is: RT-PCR specifically refers to reverse transcription PCR , Real-time PCR is generally abbreviated as qPCR (quantitative real-time PCR).
And real-time RT-PCR (RT-qPCR), It is the reverse transcription PCR combined with the fluorescent quantitative technology : first obtain cDNA (RT) from RNA reverse transcription, and then use Real-time PCR for quantitative analysis (qPCR). Most laboratories do RT-qPCR, that is, research on RNA expression down-regulation, so the qPCR that everyone talks about in the laboratory actually refers to RT-qPCR, but don’t forget that there are still many DNA tests in clinical applications. Quantitative analysis, such as hepatitis B virus HBV detection.
Question: After reading a lot of fluorescent quantitative PCR, why should the amplified fragment be controlled within the range of 80-300bp?
Answer: The length of each gene sequence is different, some are several kb, some are hundreds of bp, but we only need to require the product length to be 80-300bp when designing primers, too short or too long are not suitable for fluorescent quantitative PCR detection . The product fragment is too short to be distinguished from the primer-dimer. The length of the primer-dimer is about 30-40bp, and it is difficult to distinguish whether it is a primer-dimer or a product if it is less than 80bp. If the product fragment is too long, exceeding 300bp, it will easily lead to low amplification efficiency and cannot effectively detect the amount of the gene.
For example, when you count how many people are in a classroom, you only need to count how many mouths there are. The same is true when you detect genes, you only need to detect a certain sequence of a gene to represent The entire sequence will do. If you want to count people, you need to count both mouths and noses, ears, and glasses, and it is easy to make mistakes.
To expand, in biological research, there are many research cases from point to area, because the gene sequence of any species is very long, it is unnecessary and impossible to measure all fragments, such as bacterial 16S sequencing, which is to carry out the conservative sequence of bacteria Assays to infer the number of a certain population of bacteria.
Q: What is the optimal length for qPCR primer design?
Answer: Generally speaking, the primer length is about 20-24bp, which is better. Of course, we must pay attention to the TM value of the primer when designing the primer, because this is related to the optimal annealing temperature. After a lot of experiments, it has been proved that 60°C is a better TM value. If the annealing temperature is too low, it will easily lead to non-specific amplification. If the annealing temperature is too high, the amplification efficiency will be relatively low, the peak of the amplification curve will start later, and the CT value will be delayed.
Q: How is the dye method different from the probe method?
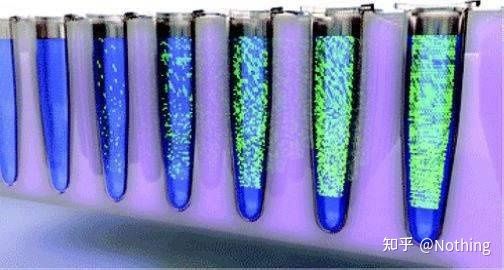
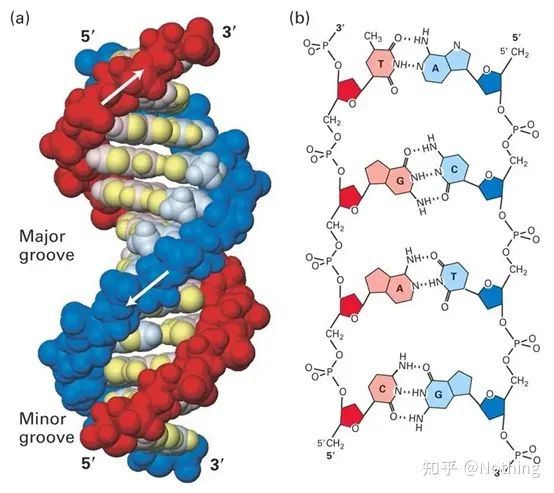
Answer: Dye method Some fluorescent dyes, such as SYBR Green Ⅰ, PicoGreen, BEBO, etc., do not emit light by themselves, but will emit fluorescence after binding to the minor groove of double-stranded DNA. Therefore, at the beginning of the PCR reaction, the machine cannot detect the fluorescent signal. When the reaction reaches the annealing-extension stage, the double strand is opened, and a new strand is synthesized under the action of DNA polymerase, and the fluorescent molecule binds to the dsDNA minor groove. As the number of PCR cycles increases, more and more dyes are combined with double-stranded DNA, and the fluorescent signal is also continuously enhanced. The dye method is mainly used in scientific research.
PS: Be careful when doing the experiment, the dye has to be combined with human DNA, be careful to turn it into a fluorescent person.
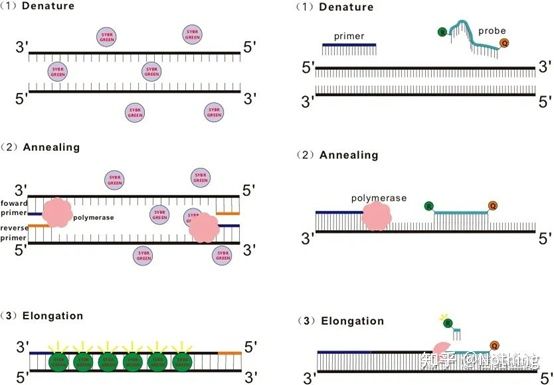
Dye method (left) Probe method (right)
PS: Be careful when doing the experiment, the dye has to be combined with human DNA, be careful to turn it into a fluorescent person.
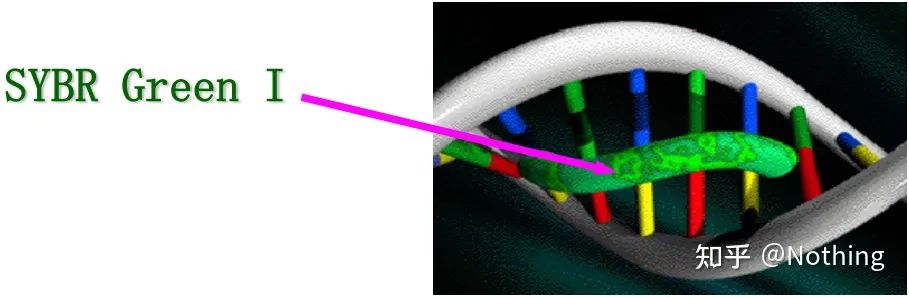
SYBR Green Ⅰ binds to the minor groove of DNA
Probe method Taqman probe is the most commonly used hydrolysis probe. There is a fluorescent group at the 5′ end of the probe, usually FAM, and the probe itself is a sequence complementary to the target gene. There is a fluorescent quenching group at the 3′ end. According to the principle of fluorescence resonance energy transfer (Förster resonance energy transfer, FRET), when the reporter fluorescent group (donor fluorescent molecule) and the quenching fluorescent group (acceptor fluorescent molecule) are excited When the spectra overlap and the distance is very close (7-10nm), the excitation of the donor molecule can induce the fluorescence of the acceptor molecule, while the autofluorescence is weakened. Therefore, at the beginning of the PCR reaction, when the probe is free and intact in the system, the reporter fluorescent group will not emit fluorescence. When annealing, the primer and probe bind to the template. During the extension stage, the polymerase continuously synthesizes new chains. DNA polymerase has 5′-3′ exonuclease activity. When reaching the probe, the DNA polymerase will hydrolyze the probe from the template, separate the reporter fluorescent group from the quencher fluorescent group, and release the fluorescent signal. Since there is a one-to-one relationship between the probe and the template, the probe method is superior to the dye method in terms of the accuracy and sensitivity of the test. The probe method is mainly used in diagnosis.
Q: What is absolute quantification? What is Relative Quantification?
Answer: Absolute quantification refers to the calculation of the initial copy number of the sample to be tested by qPCR, such as how many HBV viruses are in 1ml of blood. The result obtained by relative quantification is the change in the amount of the target gene in a specific sample relative to another reference sample, and the gene expression is up-regulated or down-regulated.
Q: Will the amount of RNA extraction, reverse transcription efficiency, and amplification efficiency affect the experimental results?
Q: Will sample storage, extraction reagents, reverse transcription reagents, and light-transmitting consumables affect the experimental results?
Q: What method can correct the experimental data?
Regarding these issues, we will describe them in detail in the advanced and advanced sections below.
2. Advanced knowledge
With regard to real-time fluorescent quantitative PCR, we must recognize the reality that thousands of scientific research papers are published every year, among which the fluorescent quantitative PCR technology is not a small number.
If there is no common standard to measure the fluorescent quantitative PCR experiment, the results may vary widely. For the same gene of the same species, with the same processing method, the detection results will also vary widely, and it will be difficult for latecomers to repeat the same results. You No one knows which is right and which is wrong.
Does this mean that fluorescent quantitative PCR is a cheat technology or an unreliable technology? No, it is because fluorescent quantitative PCR is more sensitive and more accurate, and a little wrong operation will produce completely opposite results. A small loss is a thousand miles away . The author of the article may be repeatedly tortured by the reviewers. At the same time, the reviewers of the journal are also difficult to choose from different experimental results.
All in all, pointing to a lack of consensus in real-time PCR experiments. To this end, senior scientists in the industry began to formulate standards, requiring contributors to provide some necessary experimental and data processing details (including necessary data) in the article to meet these standards .
Reviewers can judge the quality of the experiment by reading these details; future readers can also use this to repeat the experiment or improve the experiment. Then the experimental results obtained in this way are full of information, high quality, and usable.
MIBBI (Minimum Information for Biological and Biomedical Investigations - http://www. mibbi.org ) came into being. MIBBI is a project that provides standards for experiments . It is published in nature. This project is aimed at various biological experiments, including cell biology, Microarray, qPCR we are going to discuss now, etc., and provides for each type of experiment when submitting manuscripts. That information should be provided at all times.
In the MIBBI project, there are two articles related to fluorescent quantitative PCR, namely:
·RDML (Real-Time PCR Data Markup Language) – a structured language and reporting guide for real-time quantitative PCR data;
·MIQE (Minimum Information for Publication of Quantitative Real-Time PCR Experiments) – minimum information for publishing articles about real-time quantitative PCR experiments.
First, let’s talk about RDML, the terminology specification.
If there is no standard definition for everything, it is impossible to continue the discussion, which is why the explanation of terms is so important in the exam.
The terminology used in the fluorescent quantitative PCR experiment includes the following content. QIAGEN has made the best summary for us. The following are all dry goods .
Amplification curve
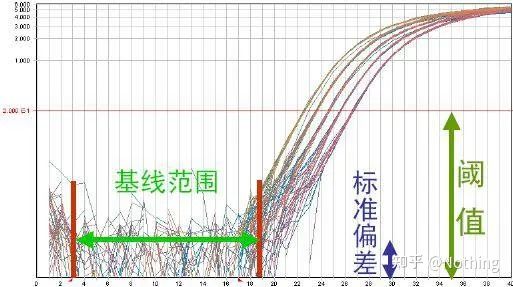
The amplification curve refers to the curve made during the PCR process, with the cycle number as the abscissa and the real-time fluorescence intensity during the reaction as the ordinate.
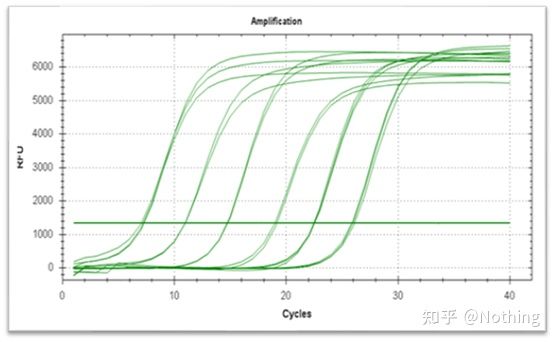
An excellent amplification curve should have the following characteristics: the baseline is flat or slightly decreased, and there is no obvious upward trend; the inflection point of the curve is clear, and the slope of the exponential phase is proportional to the amplification efficiency. The greater the slope, the higher the amplification efficiency; the overall amplification curve The parallelism is good, indicating that the amplification efficiency of each tube is similar; the exponential phase of the amplification curve of low-concentration samples is obvious.
Baseline (Baseline)
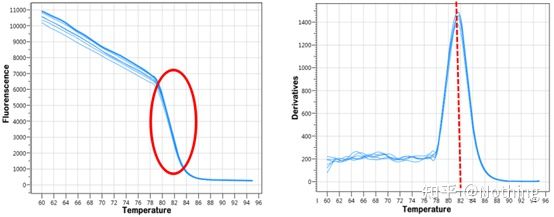
The baseline is the noise level of the early cycle , usually measured between the 3rd and 15th cycle, because the fluorescence value increase caused by the amplification product cannot be detected during this period. The number of cycles used to calculate the baseline can be varied and may need to be reduced if high template amounts are used or if the expression level of the target gene is high.
Setting the baseline requires viewing fluorescence data from the linearity amplification curve . The baseline is set so that the growth of the amplification curve begins with a cycle number greater than the baseline cycle top number. Baselines need to be set individually for each target sequence. The average fluorescence values detected in the early cycles need to be subtracted from the fluorescence values obtained in the amplified products. The latest versions of various Real-Time PCR software allow automatic optimization of baseline settings for individual samples.
During the first few cycles of the PCR amplification reaction, the fluorescence signal does not change much. Approaching a straight line is called the baseline, but if we look closely at the first few cycles, we see that within the baseline is what’s happening in the picture below.
Background Background refers to
the non-specific fluorescence value in the reaction . For example: inefficient fluorescence quenching; or a large number of double-stranded DNA templates due to the use of SYBR Green. The background components of the signal are mathematically removed by the Real-Time PCR software algorithm.
Reporter signal
Reporter signal refers to the fluorescent signal generated by SYBR Green or fluorescently labeled sequence-specific probes during Real-Time PCR.
Normalized Reporter Signal (RN)
RN refers to the fluorescence intensity of the reporter dye divided by the fluorescence intensity of the passive reference dye measured at each cycle.
Passive Reference Dye
In some Real-Time PCRs, the fluorescent dye ROX is used as an internal reference to normalize the fluorescent signal . It corrects for variations due to inaccurate pipetting, well position, and fluorescence fluctuations on a well-by-well basis.
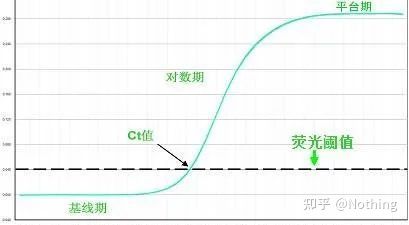
The fluorescence threshold (threshold)
was adjusted above the background value and significantly below the plateau value of the amplification curve. It must lie in the linear region of the amplification curve, representing the log-linear range of PCR detection. Thresholds should be set in the log-amplification curve view so that the log-linear phase of PCR is easily identifiable. If there are multiple target genes in Real-Time PCR, the threshold must be set for each target . Generally, the fluorescence signal of the first 15 cycles of PCR reaction is used as the fluorescence background signal, and the fluorescence threshold is 10 times the standard deviation of the fluorescence signal of the first 3 to 15 cycles of PCR, and the fluorescence threshold is set in the exponential phase of PCR amplification. In general, each instrument has its fluorescence threshold set before use.
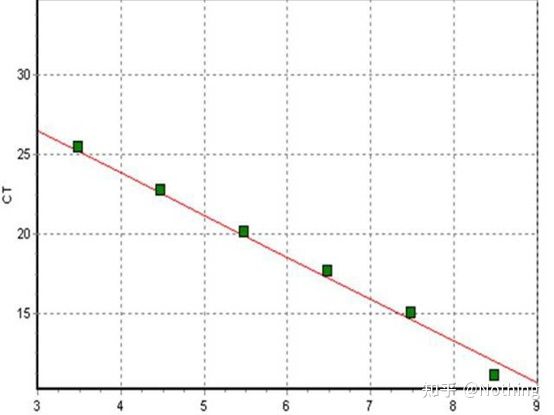
Cycle Threshold (CT) or Crossing Point (CP)
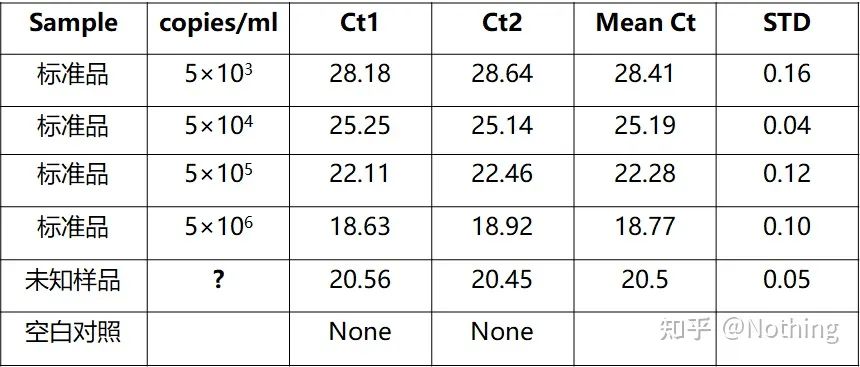
The cycle at which the amplification curve crosses the threshold (ie, the point at which fluorescence detection increases significantly). CT can be a fraction and the amount of starting template can be calculated. The CT value represents the number of cycles experienced when the fluorescent signal in each PCR reaction tube reaches the set threshold. There is a linear relationship between the CT value of each template and the logarithm of the initial copy number of the template, the higher the initial copy number, the smaller the CT value, and vice versa . A standard curve can be made by using a standard with known initial copy number, wherein the abscissa represents the CT value, and the ordinate represents the logarithm of the initial copy number. Therefore, as long as the CT value of the unknown sample is obtained, the initial copy number of the sample can be calculated from the standard curve.
ΔCT value
ΔCT value describes the difference between the target gene and the corresponding endogenous reference gene CT value , such as a housekeeping gene, and is used to normalize the amount of template used:
⇒ ΔCT = CT (target gene) – CT (endogenous reference gene)
ΔΔCT Value
The ΔΔCT value describes the difference between the mean ΔΔCT value of a sample of interest (eg, stimulated cells) and the mean ΔΔCT value of a reference sample (eg, unstimulated cells). The reference sample is also called the calibration sample and all other samples are normalized to this for relative quantification:
⇒ ΔΔCT = average ΔCT (sample of interest) – average ΔCT (reference sample)
Endogenous reference genes (endogenous reference genes)
The expression levels of endogenous reference genes, such as housekeeping genes (housekeeping genes), do not differ between samples. Comparing the CT values of the reference gene to the target gene allows the expression level of the target gene to be normalized to the amount of input RNA or cDNA (see the section on ΔCT values above).
Internal reference genes correct for possible RNA degradation or the presence of enzyme inhibitors in RNA samples, as well as variations in RNA content, reverse transcription efficiency, nucleic acid recovery, and sample handling. To select the optimal reference gene(s), we modified the algorithm to allow its selection of the optimal reference dependent on the experimental setting.
Internal control
A control sequence that is amplified in the same reaction as the target sequence and probed with a different probe (i.e., performing duplex PCR). Internal controls are often used to rule out failed amplifications, such as when the target sequence is not detected.
Calibration Sample
A reference sample (for example, purified RNA from a cell line or tissue) used in relative quantification to compare all other samples to determine the relative expression level of a gene. The calibration sample can be any sample, but is usually a control (for example, an untreated sample or a sample from time zero of the experiment).
Positive controls
use control reactions with known amounts of template. Positive controls are often used to check that a primer set or primer–probe set is working properly and that the reaction is set up correctly.
No Template Control (NTC)
A control reaction that contains all the necessary components of the amplification reaction except the template, which is usually replaced with water. The use of NTC can find the contamination caused by reagent contamination or foreign DNA, thus ensuring the authenticity and reliability of the detection data. Amplification of the NTC control indicates contamination.
No RT control (NRT)
RNA extraction process may contain residual genomic DNA, which is extremely harmful and is the culprit affecting data quality and the natural enemy of qPCR, so when designing experiments, it must be designed to only amplify RNA detection. There are two ways, one is to design primers across introns, the other is to completely remove DNA, which one is better, which will be discussed later. The NTR control is a magic mirror to detect DNA pollution. If there is amplification, it means there is pollution.
Standards
Standards are samples of known concentration or copy number that are used to construct a standard curve. In order to ensure the stability of the standard, the gene fragment is usually cloned into the plasmid and used as the standard.
The standard curve
is usually diluted into at least 5 concentration gradients with the standard product according to the doubling ratio, and 5 points are drawn in the coordinates of CT value and copy number, and the points are connected to form a line to generate a standard curve. For each standard curve, its validity needs to be checked. The slope value falls between –3.3 and –3.8, and each concentration is performed in triplicate. Points that are significantly different from other points should be discarded. The CT value of the sample to be tested is brought into the standard curve, and the expression level of the sample to be tested can be calculated.
The CT value of the sample to be tested is brought into the standard curve, and the initial copy number of the sample to be tested can be calculated.
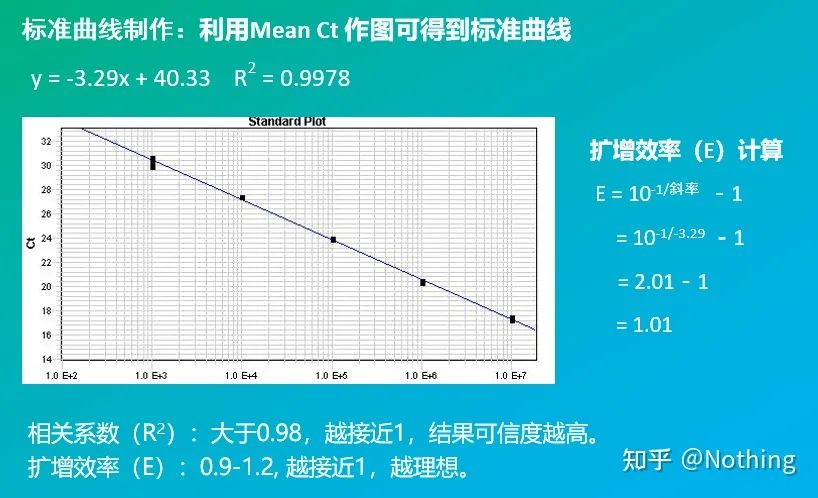
Efficiency and Slope
The slope of the standard curve represents the efficiency of real-time PCR.
·A slope of -3.322 indicates that the PCR amplification efficiency is 1, or 100% efficient, and the amount of PCR product doubles at each cycle.
·A slope less than –3.322 (eg, –3.8) indicates a PCR efficiency
·A slope greater than –3.322 (eg, –3.0) indicates that the PCR efficiency appears to be greater than 100%, which is curious, how could one cycle of PCR generate more than double the amplified product? This situation occurs in the non-linear phase of the PCR reaction, that is, there is a large amount of non-specific amplification.
melting curve
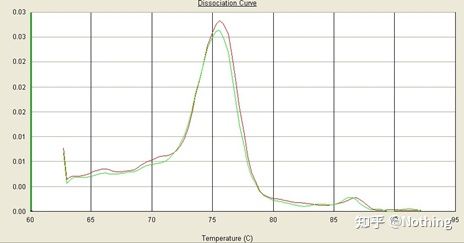
After the qPCR amplification is completed, the PCR product is heated. As the temperature rises, the double-stranded amplification product gradually melts, resulting in a decrease in fluorescence intensity. When a certain temperature (Tm) is reached, a large number of products will melt. Fluorescence drops sharply. Different PCR products have different Tm values and different melting temperatures, so that the specificity of PCR can be identified.
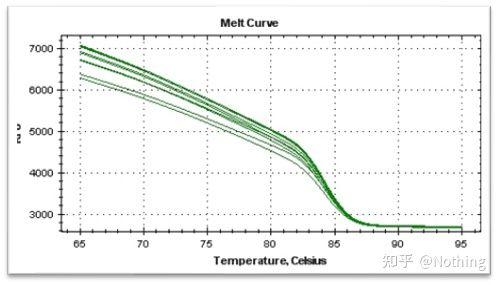
Melting curve (derivative curve)
The melting curve is derived to form a peak map, which can more intuitively display the situation of PCR product fragments. Since the melting temperature is the Tm value of the DNA fragment, some parameters that affect the Tm value of the DNA fragment can be judged, such as fragment size, GC content, etc. Generally speaking, according to our primer design principles, the length of the amplified product is in the range of 80-300bp, so the melting temperature should be between 80°C and 90°C.
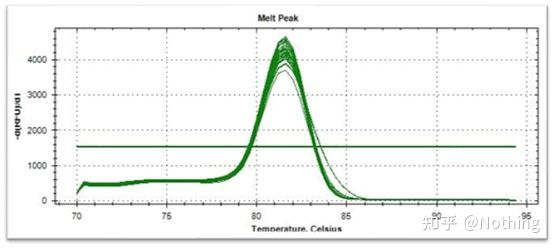
Interpretation of the melting curve: If the only main peak appears between 80°C-90°C, it means that the fluorescent quantitative PCR is perfect; if the main peak appears between 80°C-90°C and miscellaneous peaks appear below 80°C, the primer dimer is basically considered. You can try to increase the annealing temperature to solve it; if the main peak appears between 80°C-90°C, and the miscellaneous peak appears again when the temperature rises, it is basically considered that there is DNA contamination, and DNA needs to be removed at the initial stage of the experiment.
Of course, there are still some abnormal situations, which will be broken down one by one below.
3. Advanced knowledge
To do qPCR, I have to say MIQE, Minimum Information for Publication of Quantitative Real-Time PCR Experiments —the minimum information for publishing articles about real – time quantitative PCR experiments . In order to simplify everyone’s understanding, we will simplify the key content.
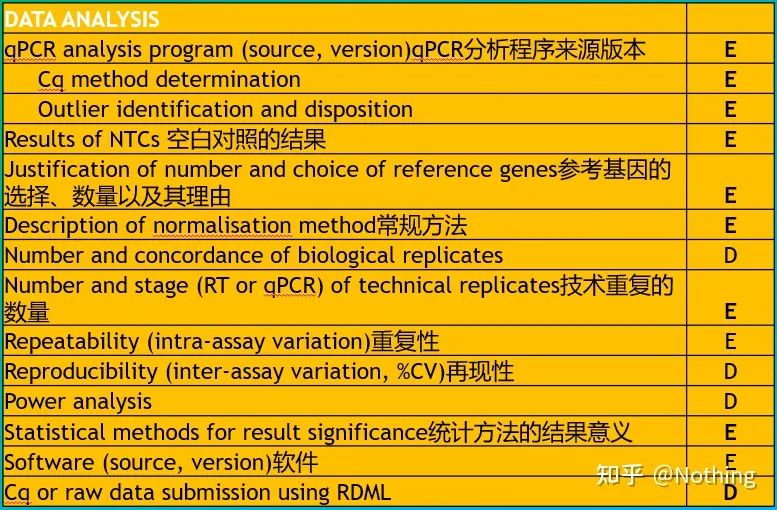
You can search the original text of MIQE on the Internet, and the most important thing is that it stipulates the data checklist that needs to be provided when publishing an article .
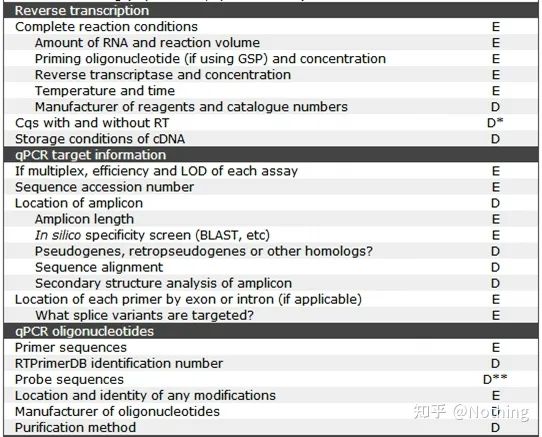
Reviewers can judge the quality of the experiment by reading these details; future readers can also use this to repeat or improve the experiment.
It is worth noting that in this list, the importance of each list is marked with E or D respectively. What does it mean? E: essential information (must be submitted); D: desirable information (provide as much as possible).
MIQE (1)—Experimental Design
Many scumbags who have completed their defense after finishing their graduate studies will not know how to design an experiment independently, open their notebooks, and do what the teacher tells them to do. As a result, the experimental design was not rigorous, and the editorial department of the magazine said that they wanted to make up this picture and that picture, so they did it in a daze. This is how the scumbags are made!
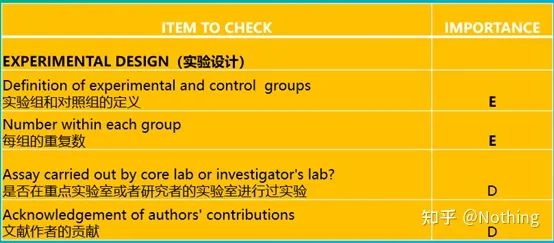
Closer to home, the first principle of the experiment is to determine the rigor of the experimental logic . The most fundamental thing is the experimental design, and the most important thing about the experimental design is how to set the target sample, reference sample (control), and the number of repetitions, so that the experimental data can be referenced, comparable, and convincing.
The target sample refers to the sample that requires us to detect the target gene after a certain treatment. The reference sample is the sample without any treatment, which is often referred to as wild type in biology.
Experimental replicates are very important. Generally, the number of persuasive replicates must be more than three. It is necessary to distinguish what is biological replication and what is technical replication.
Biological Replicates: The same verification experiment done with different materials (time, plants, batches, reaction plates).

Biological duplication
Let’s take the pesticide treatment of pepper as an example. We want to spray pesticides on the three plants of ABC, then the three plants of ABC are three biological replicates, and they are the same verification experiment carried out with different materials. But as an experiment, a control is definitely needed, so we can spray one of the branches of plant A to form an experimental group of plant A, and not spray the other branches of plant A to form a control group. Do the same for B and C.
Technical Replicates (Technical Replicates) : It is a repeated experiment designed to avoid errors caused by operation, which is actually a duplicate hole included in the same material. Both treatments and controls must have replicate settings (minimum three) of the target gene and the internal reference gene.
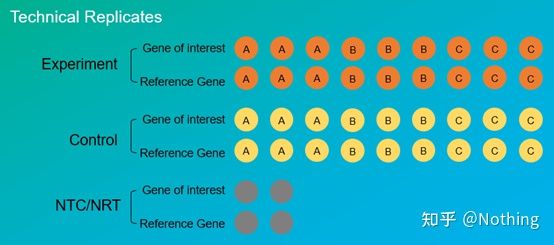
Technical repetition
Take the pepper treated with pesticides as an example again. For the experimental group of plant A, we made three PCR holes of 1, 2, and 3 for its target gene and internal reference gene respectively, so as to take the average after the detection. For the control of plant A Groups are also treated in the same way. Similarly, do the same treatment for B and C plants. This is technical repetition.
It is worth noting that what enters the statistics is the biological repetition, and the technical repetition is to test whether there are any random phenomena in the experimental process, so as to make the experimental results credible, that is, to avoid errors by taking their average as we often say.
Negative Controls—NTC and NRT
NTC (No-Template Control) , a control without a template, is used to verify whether the experimental material is contaminated. Generally, water is used as a template. If there is a fluorescent reaction, it indicates that nucleic acid contamination has occurred in the laboratory.
These pollutions come from: impure water, unqualified reagents containing endogenous DNA, primer pollution, laboratory equipment pollution, aerosol pollution, etc., need to use RNase scavengers and RNase inhibitors. Aerosol pollution is the most difficult to find. Imagine your laboratory is like smog, with various nucleic acids suspended in the air.

NRT (No-Reverse Transcriptase) , the control without reverse transcription, is the non-reverse transcribed RNA as a negative control, which is the control of gDNA residue.
When doing gene expression, the amount of RNA is detected by detecting the amount of cDNA after reverse transcription. If there is gDNA residue when RNA is purified, it will cause errors in the experimental results, because the actual results obtained are gDNA and cDNA. At the aggregate level, not just cDNA, gDNA needs to be completely removed during RNA extraction.
MIQE (2)—sample information
The so-called sample information means that when we publish an article about qPCR, we must explain the sample information clearly, which is an indispensable part of the article. Similarly, when we process samples, we must also regulate our own operations to ensure the validity of the samples.
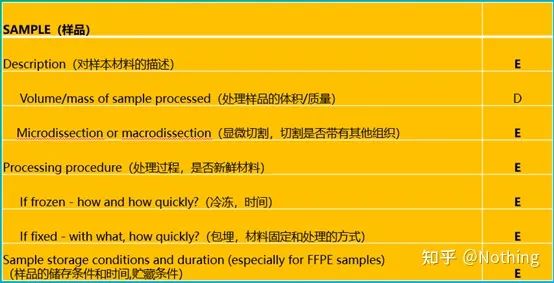
The description of the sample is only a result, and we should pay more attention to the materials taken during the whole experiment.
Selection of experimental materials
Blood samples – choose fresh blood, no more than 4 hours. Cell samples – choose to collect fresh cells in a period of vigorous growth. Animal Tissue—Choose fresh, vigorously growing tissue. Plant Tissue – Choose fresh, young tissue.
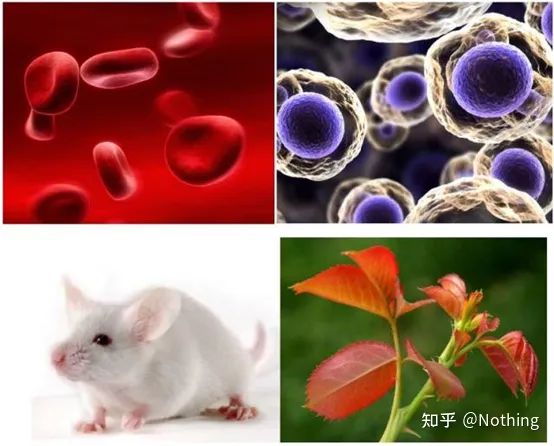
You must have noticed that there is a key word in these few sentences: fresh .
For the above samples, the best, cost-effective, and stable kit on the market is Foregene’s kit, which can quickly and easily extract their DNA and RNA.
Animal Total RNA Isolation Kit
Plant Total RNA Isolation Kit Plus
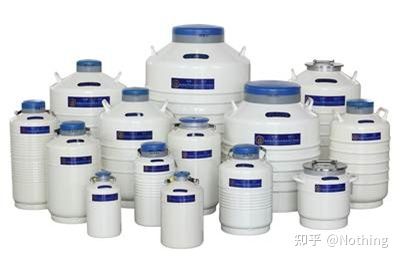
Storage of experimental materials
Generally speaking, we do not recommend storing samples, if conditions permit. However, there are many friends who cannot conduct experiments immediately after sampling, and some even need to carry liquid nitrogen tanks to the field for sampling.
For this kind of hard-working friend, I can only say that you do not understand reagent consumables. Now many reagent consumable companies produce reagents that can store RNA samples at room temperature, and you can choose to use them. The conventional storage method is liquid nitrogen storage, using a small liquid nitrogen tank that is easy to carry. After bringing the sample back to the laboratory, store it in a -80°C refrigerator.
For experiments involving RNA, the six-word principle must be followed: low temperature , no enzymes , and fast .
The concept of low temperature is easy to understand; without enzymes, RNase is everywhere in the world we live in (otherwise you would have been killed by HIV), so how to avoid RNase when doing experiments is a very important concept; fast, There is no Kung Fu in the world that cannot be broken, only speed cannot be broken .
Therefore, in a sense, the shorter the extraction time, the better the kit. Why does Foregene ‘s kit emphasize speed, because they know it well.
PS: Some girls do experiments very carefully, but they are not as good as a slam dunk after several years of work. They feel that God is unfair, complaining about others, and looking for life. In fact, she didn’t understand it. He didn’t protect the RNA well, and the slam dunk player was nimble. When he was doing the experiment, he thought that he would finish the slam dunk with three times, five times and two divisions, but he did the experiment well.
Note: Slower, more chances of RNase invasion. How to train yourself to be fast? There is no way, just practice more.
For different experiments and different samples, it is still necessary to read more literature and choose an appropriate method for processing. For the sample collection and storage process, MIQE requires that it must be clearly written in the paper, so that the reviewers can review the reliability of the paper, and it is also convenient for the stunned youngsters to repeat your experiment.
Although biological experiments are difficult, they are high-end. If you are not careful, you can overturn the world. For example, making SARS into a biochemical crisis, or making hybrid rice to save 1.3 billion people. The picture below is a chemical experiment, you should understand how proud you are of your research just by looking at his dick-like appearance. Forget it, don’t black him.

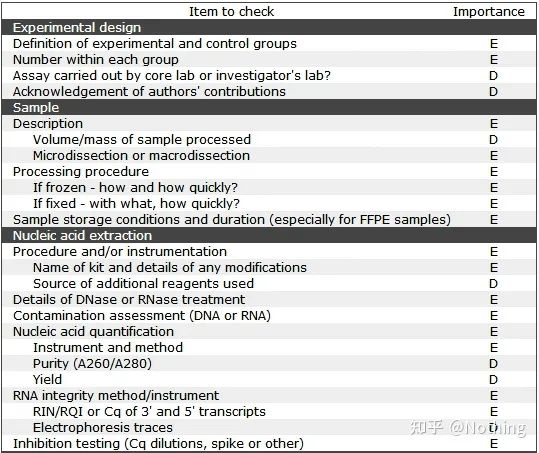
MIQE (3) – nucleic acid extraction.
Nucleic acid extraction is a big event, and all molecular biology experiments start with nucleic acid extraction. First of all, let’s copy MIQE’s content on nucleic acid extraction.
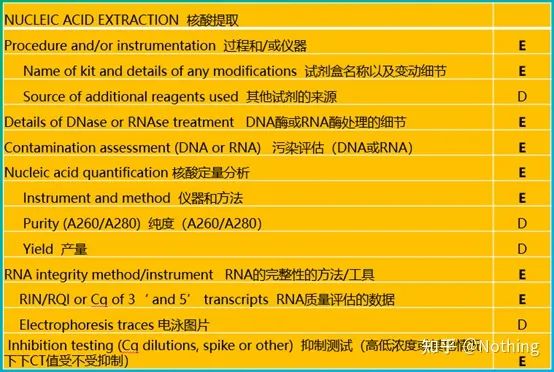
Looking at this form, you can’t stay on the surface. The form is a dogma. To be a top student, you must ask why. The essential content of this table is: Pursue the purity, integrity, consistency, and extraction amount of RNA .
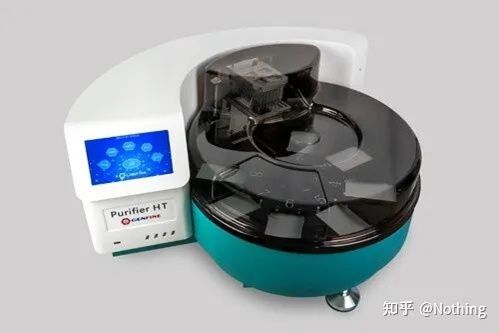
The first part of the process or instrument is the nucleic acid extraction step. If you use an automatic nucleic acid extractor to extract (advanced, please contact me for purchase), you need to indicate the model name of the instrument.
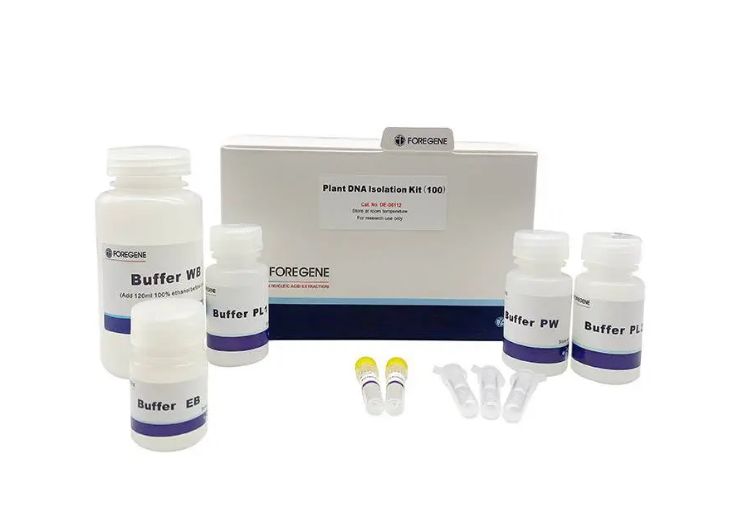
The name of the kit and
what kit was used for the change details, what special reagents were added or what special operations were done should be explained clearly so that others can easily repeat your experiment.
Some people add some special reagents when extracting special samples, thinking that this is their secret weapon and don’t tell others. While keeping it secret, they also lose the opportunity to make your article shine. Don’t be clever, you have to be more honest than the country old Zhang in scientific research, if you want to be clever, the article will make you stupid.
must remember the product number of the kit when you order the kit and write the article . There are generally two numbers on the kit: Cat—catalog number (product number, article number), Lot—product lot number ( Used to indicate which batch the product came from).
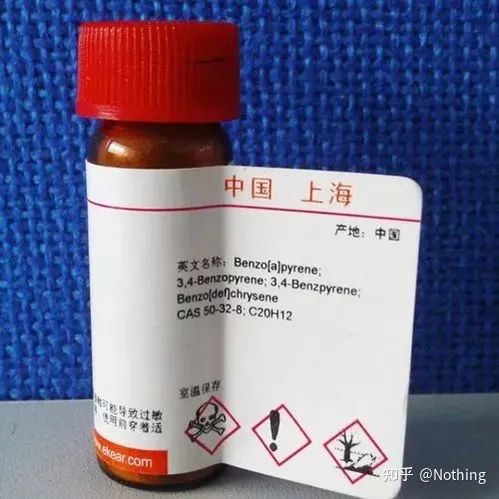
In addition, the CAS number is often used when ordering biochemical reagents, and I will popularize it together. The CAS number is the number given by the American Chemical Society to each new chemical drug. Generally, three numbers are connected by a dash. Rushui’s CAS number: 7732-18-5. Chemicals often have multiple aliases, but the CAS number is unique. When ordering medicine, you can check its CAS number first.
Closer to home, why do we have to describe these things clearly? In fact, it is also to check the quality of RNA extraction. The use of instruments and kits will make RNA extraction more consistent. The extraction scale of ordinary laboratories is not large, and it can be obtained with kits.
The details of DNase or RNase treatment
The important issue of fluorescent quantitative PCR is to prevent DNA contamination, and do not experiment if there is contamination. Therefore, it is imperative to state the process you used to process the DNA, in order to demonstrate that the DNA in the experimental process has been completely and completely removed. represented by a schematic diagram.

Schematic diagram of RNA and DNA
In general, the method for removing DNA is to treat RNA with DNase after extraction. However, these are relatively old methods. Commercial RNA extraction kits have been able to remove DNA during the extraction process without adding DNase . For example, a series of kits from Foregene .
Note: Removing DNA during RNA extraction is a very dangerous double-edged sword, which will prolong the operation time of RNA extraction and increase the risk of RNA degradation. Basically, it is a trade-off between RNA yield and purity.
In addition, the amount of DNase added to the silica-based adsorption column is very small, and high-quality DNase must be used to achieve the effect. Unoptimized DNase cannot be digested quickly and completely. This is a test of the merchant’s technical level. Of course, there are even more weird merchants who boast that DNA can be removed without DNase. It can be said that anyone who brags that DNA can be completely removed without DNase is a hooligan. DNA is a relatively stable double-stranded structure, and it cannot be wiped out just by talking and laughing.
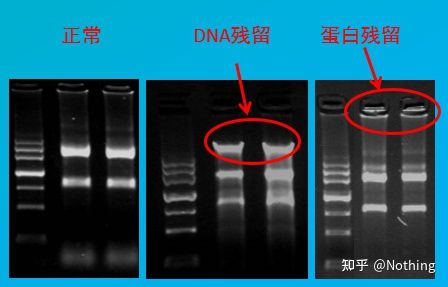
Contamination assessment
assessment method: electrophoresis detection, 1% agarose, 6V/cm, 15min, loading 1-3 ul
Nucleic acid quantitative analysis
is usually measured using a UV spectrophotometer. Let me first popularize the meaning of the three values of OD260, OD280, and OD230.
·OD260nm: It is the absorption wavelength of the highest absorption peak of nucleic acid, and the best measured value ranges from 0.1 to 1.0. If not, dilute or concentrate the sample to bring it within range.
·OD280nm: It is the absorption wavelength of the highest absorption peak of protein and phenolic substances.
·OD230nm: It is the absorption wavelength of the highest absorption peak of carbohydrates.
Next, let’s talk about the role of each indicator. For A260, it can be used to measure the yield of nucleic acid. When OD260=1, dsDNA=50μg/ml, ssDNA=37μg/ml, RNA=40μg/ml.
For purity, we need to look at the ratios that we commonly see: OD260/280 and OD260/230.
·Pure DNA: OD260/280 is approximately equal to 1.8. When it is greater than 1.9, it indicates that there is RNA pollution, and when it is less than 1.6, it indicates that there is protein and phenol pollution.
·Pure RNA: 1.7<OD260/280<2.0, less than 1.7 indicates protein and phenol contamination, and greater than 2.0 indicates residual isothiocyanate.
·OD260/230: Whether it is DNA or RNA, the reference value is 2.5. When it is less than 2.0, it indicates that there is pollution of sugar, salt and organic matter.
RNA integrity
It is very important to measure the integrity of RNA. Generally, it is necessary to do an RNA denaturation gel experiment to check whether the brightness between 28S and 18S RNA is a two-fold relationship. When the third band 5S appears, it means that the RNA has begun to degrade, except for invertebrates.

Data for RNA quality assessment: In addition to the above tests, there are also some more advanced instrument tests in terms of RNA integrity, such as the RQI integrity test of the Experion automatic electrophoresis system, which can detect whether RNA is degraded invisibly.
In scientific research, fluorescent quantitative PCR is a comparison between the target gene and the internal reference gene. Therefore, in the process of RNA sample preservation, RNA extraction, etc., the primary goal is to ensure the integrity of RNA .
How the integrity of RNA affects the balance between the target gene and the internal reference gene can be easily understood from the figure below. Degradation will lead to gene incompleteness, whether it is the incompleteness of the internal reference gene or the incompleteness of the target gene, it will have a great impact on the data.

Schematic diagram of target gene and reference gene, must not be true
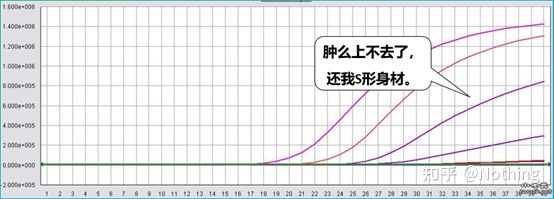
Inhibition test (whether the CT value is suppressed under high or low concentration or other conditions)
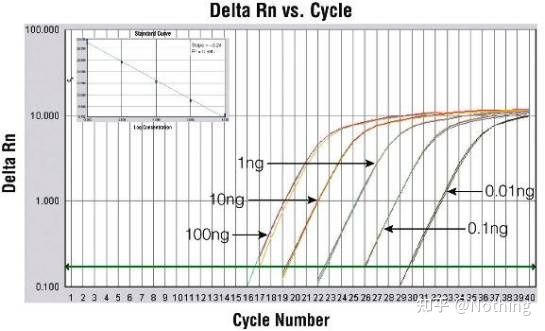
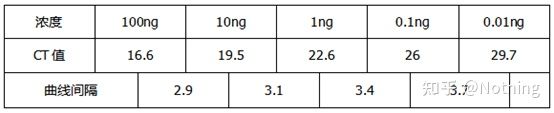
Taking this figure as an example, the Ct values of the five curves are as follows. The distribution of CT values between the curves is uneven, and the Ct values are delayed under high and low concentrations, which is the case of PCR inhibition.
Key point: In the process of RNA extraction, we need to abandon misconceptions and establish correct ones.
The wrong idea is: RNA extraction only pursues the yield, thinking that the larger the amount of RNA obtained, the better. In fact, when we do quantification, if the number of genes is not very large, we don’t need much RNA. The amount of RNA you extract is more than enough .
The correct concept is: RNA extraction should pursue purity, integrity and consistency . Purity can ensure that the subsequent reverse transcription is not inhibited and the data will not be affected by DNA. Integrity ensures the balance of target sequences and internal references. Consistency ensures stable sample loading.
MIQE (4) – reverse transcription
Misconception: the pursuit of higher sample volume.
Correct concept: Pursue consistency (stability), regardless of the amount of RNA loaded, the efficiency of reverse transcription remains consistent, ensuring that differences in cDNA can truly reflect differences in mRNA.
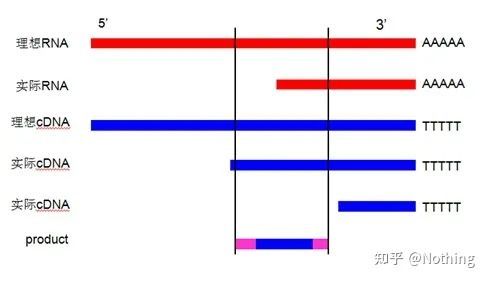
We explain this process with a schematic diagram:

Schematic diagram of reverse transcription efficiency, do not be true
First of all, we need to understand the difference between the reverse transcription process and the PCR process. PCR undergoes multiple heating and annealing processes, and the target fragment grows exponentially; while reverse transcription does not have this process, we can imagine that reverse transcription is actually one-to-one During the replication process, as many pieces of RNA
as there are can get as many pieces of cDNA Information, it should be understood by now, because fragments large and small have been reverse-transcribed, and it is impossible to focus on one fragment. And because the amount of RNA is relatively small, the amount of cDNA obtained is also relatively small, unlike PCR, which has an amplification effect, so it is basically impossible to detect.
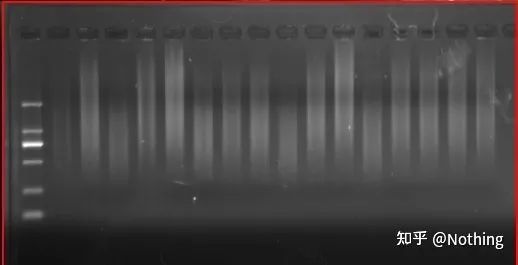
cDNA electrophoresis results
Secondly, ideally, reverse transcription is performed one-to-one, but no reverse transcriptase from any company can achieve this effect. Basically, the efficiency of most reverse transcriptases wanders between 30-50%. If this is the case, we would rather have a relatively stable reverse transcription efficiency, which is what we want to see in the figure: 3 RNAs get 2 cDNAs, 6 RNAs get 4 cDNAs, so no matter how much sample is loaded , the reverse transcription efficiency is relatively stable. We don’t want to see the situation where reverse transcription efficiency is unstable and high concentration is inhibited.
So, how to verify whether the reverse transcription efficiency is stable? The method is very simple, you only need to do a comparison test: one is to reverse transcribe into cDNA after doubling dilution of RNA, and the other is to make doubling dilution after reverse transcribing into cDNA, and then do qPCR to see the obtained slope Is it consistent. As a top student, you should understand it in seconds. As shown below:
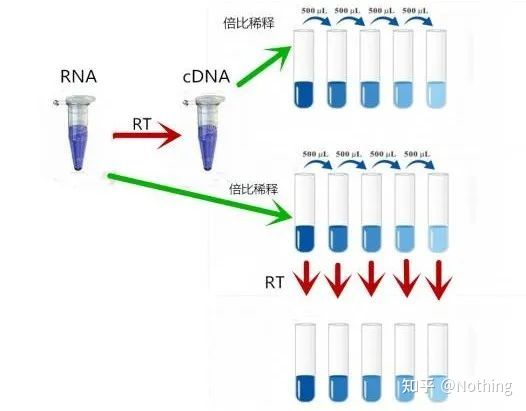
Dilution of RNA and cDNA to test whether the efficiency of reverse transcription is stable
Reverse transcriptase and kit
How can perfect fluorescent quantitative PCR have excellent reverse transcriptase and kit. Reverse transcriptase is roughly divided into two types according to the source, AMV or M-MLV , and their performance is the same as that shown in the table.
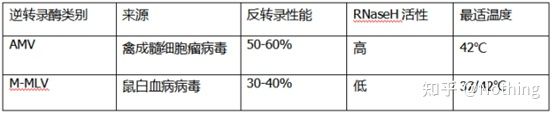
RNase H activity
RNase H is Ribonuclease H, the Chinese name is ribonuclease H, which is an endoribonuclease that can specifically hydrolyze RNA in the DNA-RNA hybrid chain. RNase H cannot hydrolyze the phosphodiester bonds in single-stranded or double-stranded DNA or RNA, that is, it cannot digest single-stranded or double-stranded DNA or RNA. Commonly used in the synthesis of the second strand of cDNA.
It’s a strange thing. We say that reverse transcriptase has RNase H activity, not that reverse transcriptase contains RNase H, and it may not be possible to separate RNase H from reverse transcriptase, perhaps because of the conformation of certain groups in reverse transcriptase This activity is caused by the reverse transcriptase.
Therefore, regardless of the higher reverse transcription efficiency of AMV, its RNase H activity reduces the yield of cDNA. Of course, reagent manufacturers are constantly optimizing their products to eliminate RNase H activity in reverse transcriptase as much as possible to increase the yield of cDNA.
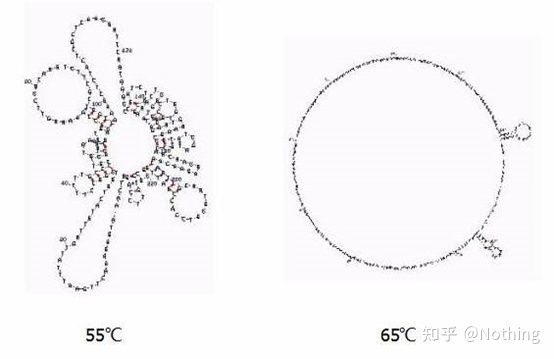
Annealing temperature

Secondary structure of RNA at different temperatures
See the figure above for the secondary structure of RNA at different temperatures, and use the mFold online tool to determine the secondary structure of the target fragment under specific temperature and salt concentration conditions. At 55°C, the secondary structure of the RNA is still very complex, reverse transcriptase cannot work, and the secondary structure cannot be completely resolved until 65°C, while the optimum temperature of AMV and M-MLV is far lower than this temperature.
what to do? The secondary structure is the complementary pairing of the template itself, which leads to strong competition between the primer and reverse transcriptase and the template, resulting in a series of problems such as low E and poor repeatability.
what to do? Only increase the annealing temperature as much as possible .
Many reagent manufacturers are improving their reverse transcriptase through genetic engineering. Some increase the reaction temperature, such as Jifan and Aidelai, and some remove the active group of RNase H enzyme to improve the affinity between the enzyme and the RNA template. High affinity can competitively squeeze out the secondary structure and read through smoothly, and also greatly improve the efficiency of reverse transcription.
Key point: Reverse transcription is more important to pursue the consistency of reverse transcription efficiency (enzymes must not only be efficient but also stable), rather than the amount of sample loaded, if it is not a particularly large-scale fluorescent quantitative PCR, it will not be possible at all. Multiple cDNAs.
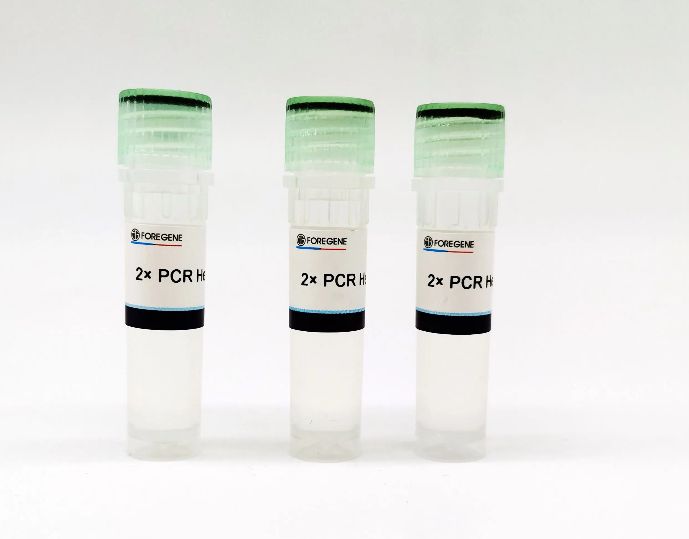
Various manufacturers have also made some efforts in the pursuit of consistency. For example, most companies have now packaged reverse transcription as a standard kit for sale, which is a good choice.
For example, Foregene’s RT Easy Series kits:
RT Easy I(Master premix for first strand cDNA synthesis kit )
MIQE (5) – target gene information
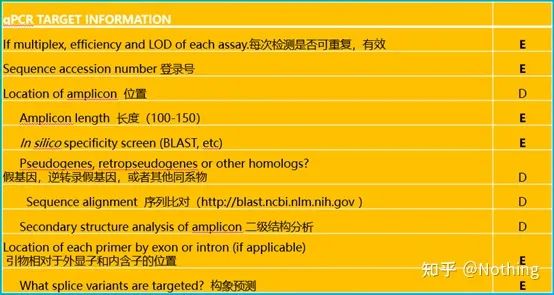
The above figure explains
1. Whether this gene is effective for repeated experiments can generally be verified by repeated experiments.
2. Gene ID, you know.
3. Gene length, the total length of the target gene is definitely no problem. When designing primers, ensure that the length of the amplicon is between 80-200bp to ensure a better amplification efficiency.
4. Sequence Blast comparison information, the target gene needs to be compared in genebank to prevent non-specific amplification.
5. Presence of pseudogenes. A pseudogene is a DNA sequence similar to a normal gene but loses its normal function. It often exists in the multi-gene family of eukaryotes. It is usually represented by ψ. It is a non-functional genomic DNA copy in the genome that is very similar to the coding gene sequence. , are generally not transcribed, and have no clear physiological meaning.
6. Position of primers relative to exons and introns. In the early years, when we solved the problem of DNA contamination, we often paid attention to the positions of primers, exons, and introns, and generally considered designing primers across introns to avoid DNA amplification. Please see the figure below: black represents introns, various blues represent exons, pink represents common primers, and bright red represents intron-spanning primers.
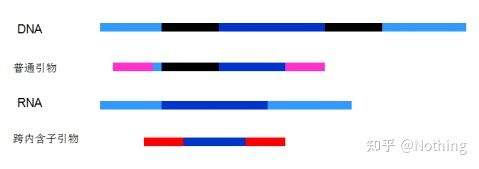
Schematic, never true
What a perfect plan this seems, but in fact, in most cases, the trans-intron primers are not as magical as imagined, and they will also cause non-specific amplification. So the best way to prevent DNA contamination is to remove DNA completely.
7. Conformation prediction. Using this example again, use the mFold online tool to determine the secondary structure of the target fragment at a specific temperature and salt concentration.
Secondary structure of RNA at different temperatures
The secondary structure is the complementary pairing of the template itself, which will lead to strong competition between the primer and template pairing, and the chances of primer binding are less, resulting in a series of problems such as low E and poor repeatability. Through software prediction, if there is no secondary structure problem, that would be great. If there is, our follow-up article will specifically discuss how to solve this problem.
MIQE (6)—qPCR Oligonucleotides
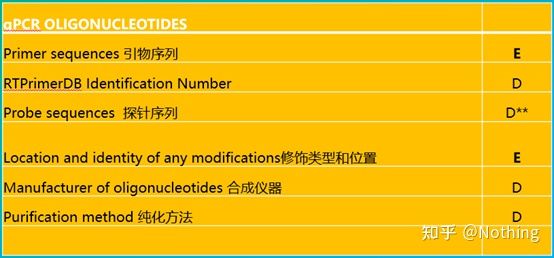
For fluorescent quantitative PCR, the first thing you struggle with every day is RNA extraction, and the second thing may be primer design.
First of all, we still check the rules about primer design according to the MIQE checklist. It is so simple that the scumbags can laugh, and we can finish it in one sentence: find out the sequence and position of the primer probe and the modification method. For the primer purification method, primer synthesis is so cheap at present, qPCR is worthy of PAGE and above purification methods, and the information of the synthesis instrument is not important. Many people have been doing primers for decades and do not know that the synthesizer is ABI3900.
Regarding the principles of primer design, you don’t have to memorize them by rote, because most primer design software or online tools can take care of these problems (recommended online tool primer3.ut.ee/), and 99.999% of primer design is not done manually Look, the author sometimes designs hundreds of primers a day, if you read one by one, it will become cross-eyed.
Just check the following points after the primers are designed:
1. Design primers close to the 3′ end: In the case of using oligo dT primers for cDNA first-strand synthesis, considering the reverse transcription efficiency and RNA integrity, the designed primers need to be designed close to the 3′ end to improve amplification efficiency . Use a picture to explain as follows (there is no way to understand this):
Why should primers be designed close to the 3′ end, it must not be true
2. TM value: The Tm value is at 55-65°C (because the exonuclease activity is the highest at 60°C), and the GC content is at 40%-60%.
3. BLAST: In order to avoid non-specific amplification of the genome, Blast must be used for supplementary verification.
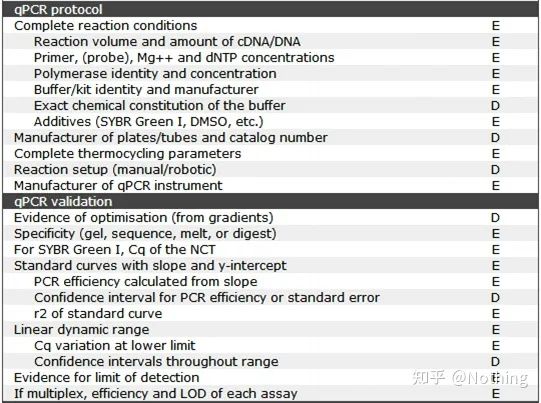
MIQE(7)—qPCR process
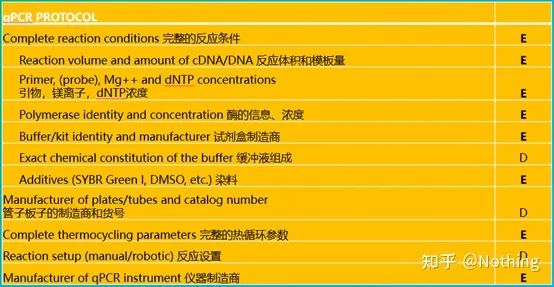
1. qPCR kit
According to the requirements of MIQE, we must clearly describe the complete reaction conditions in the article, including the configuration of the PCR reaction system, what kit is used, who is the manufacturer, how big is the reaction system, whether the dye method or the probe method is used, PCR program settings. Veteran drivers will definitely find that as long as the kit is selected, the above information is basically determined.
At present, the manufacture and production of fluorescent quantitative PCR kits is a very mature technology. As long as you don’t choose extremely bad manufacturers, the probability of problems is not high, but we still want to share with you a few points:
Hot-start Taq enzyme: The most important part of PCR is the hot-start Taq enzyme. The hot-start enzymes on the market are generally divided into two types, one is a chemically modified hot-start enzyme (you can imagine it as paraffin embedding), and the other is Is a hot-start enzyme for antibody modification (antigen-antibody binding). Chemical modification is an early way of hot-starting enzymes. When a certain temperature is reached, the enzyme will release its activity. The antibody-modified hot-start enzyme uses biological methods to block the activity of the enzyme. When a certain temperature is reached, the antibody will be denatured and inactivated as a protein, and the enzyme activity will be brought into play.
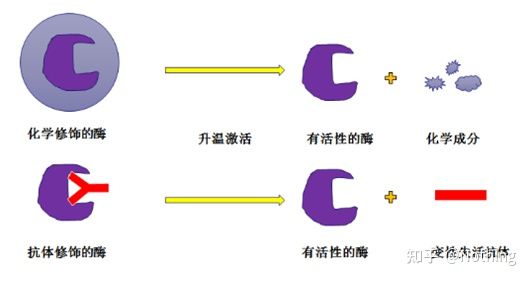
However, what is the use of this? This is the case, the release activity of antibody-modified enzymes is faster than that of chemically modified enzymes, so in terms of sensitivity, antibody-modified enzymes have a slight advantage, so that there are basically no chemically modified enzymes in the kits on the market. If there is, then this manufacturer’s technology is still stuck in the era of the millennium.
Magnesium ion concentration: Magnesium ion concentration is very important in the PCR reaction. Appropriate magnesium ion concentration can promote the release of Taq enzyme activity. If the concentration is too low, the enzyme activity will be significantly reduced; if the concentration is too high, the enzyme-catalyzed non-specific amplification will be enhanced. The concentration of magnesium ions will also affect the annealing of primers, the melting temperature of the template and PCR products, thereby affecting the yield of amplified fragments. The concentration of magnesium ions is generally controlled at 25mM. Of course, for a good kit, the concentration of magnesium ions must be well controlled. Some merchants add a magnesium ion chelating agent to the reagent, which can achieve the effect of automatic adjustment of the magnesium ion concentration.
Fluorescent dye concentration: Fluorescent dye, which is the SYBR Green we usually use, mainly generates fluorescence by binding to the minor groove of double-stranded DNA, because the binding of the dye to double-stranded DNA is non-specific, that is to say As long as double-stranded DNA is combined with it, fluorescence can occur, so primer-dimers and DNA templates in the system will combine with it to form a background signal.
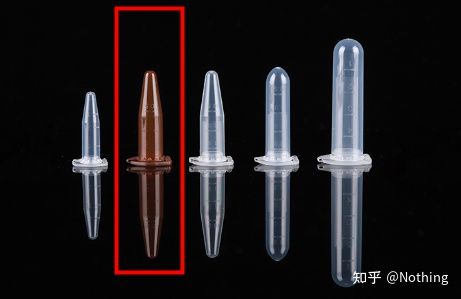
PS: Due to its light-sensitive properties, products on the market are generally packaged in brown opaque centrifuge tubes (as shown in the picture below). However, this will encounter a problem. It is difficult to see whether the liquid is sucked when sampling. In this respect, Qingke is indeed the most user-friendly (as shown in the picture below), and the transparent tube is packaged in an opaque tin bag. Then put it into a tin bag, taking into account the convenience of avoiding light and sampling. You must choose the right product number. TSE204 is a super cost-effective existence, which makes me want to plant grass.
The concentration of the fluorescent dye is also very important. If the concentration is too low, the amplification curve will not go up in the later stage and is not perfect; if the concentration is too high, it will cause noise interference. Since the fluorescent quantitative PCR mainly depends on the CT value, if the concentration of the fluorescent dye is not adjusted properly, the low point is better than the high point. Of course, the appropriate dye concentration is the best.
ROX: ROX dyes are used to correct for well-to-well fluorescence signal errors. Some instrument manufacturers require calibration, while others do not. For example, the use of Thermo Fisher Scientific’s Real Time PCR amplification instrument usually requires calibration, including 7300, 7500, 7500Fast, StepOnePlus, etc. The general kit instructions will describe it.
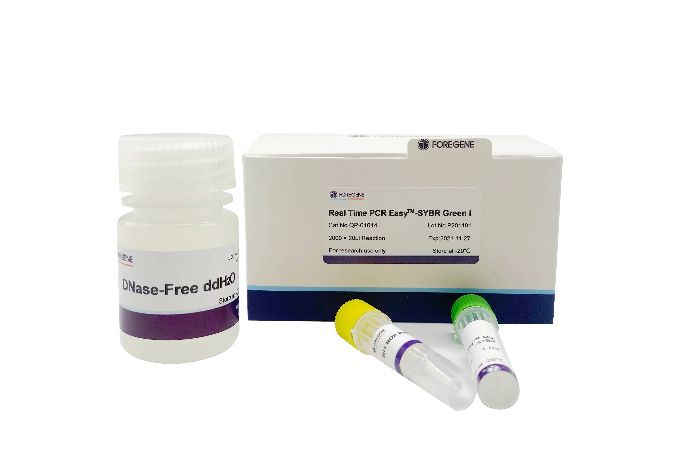
Foregene’s qPCR Mix also contains ROX dye, which is convenient for use in various models.
Weak hydrogen bond treatment: The treatment of weak hydrogen bonds is a relatively technical matter. Nothing has read the manuals of many kits, but none of them mentioned this topic. In fact, it is so important. The combination of bases mainly depends on the strength of hydrogen bonds. Strong hydrogen bonds are normal amplification, and weak hydrogen bonds lead to non-specific amplification. If weak hydrogen bonds cannot be eliminated well, non-specific amplification cannot be avoided. Within the scope of the author, only a few companies have noticed this problem. When you buy the kit, you can refer to whether you have considered a solution in this regard for the kit you want to choose.
Reaction volume: The 20-50ul system is more commonly used, and smaller volumes are likely to cause errors. Generally speaking, the kit instructions will recommend the use of PCR reaction volumes. Don’t be smart and use smaller volumes to save costs. the goal of. The volume recommended by the merchants has actually been tested, and it may be that they cannot solve the problem of errors caused by small volumes.
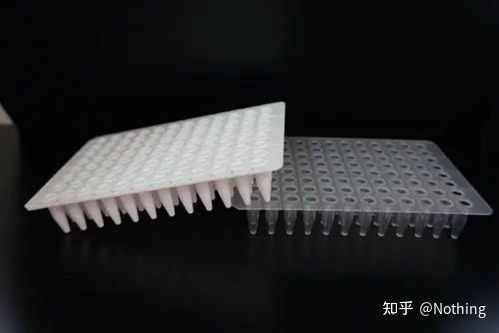
2. The manufacturer and article number of the tube plate
Everyone knows the principle of fluorescent quantitative PCR. Fluorescence collection is mainly carried out through PCR tube caps. When choosing PCR consumables, pay attention to two points: good light transmission and suitable for the instrument. Generally speaking, the boards and tubes of mainstream brands are fine, but you have to choose carefully in terms of adaptation, otherwise you will not be able to use the instrument.
4. Top level knowledge
MIQE (8)—qPCR validation
This is the top priority of qPCR! So many heroes have fallen into the sand here. Of course, it is also possible that you are lucky and the genes you studied are simple, so you floated through the ice cave along the wind. The verification information of qPCR is intended to test the reliability of the data. We list the necessary verification information as follows:
1.Specificity test
The specificity of target gene amplification is tested by checking whether the electrophoresis picture is a single band; sequencing verification; melting curve to see if the peak map is single; enzyme digestion verification and other methods.
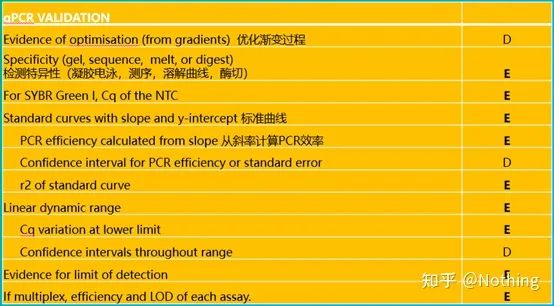
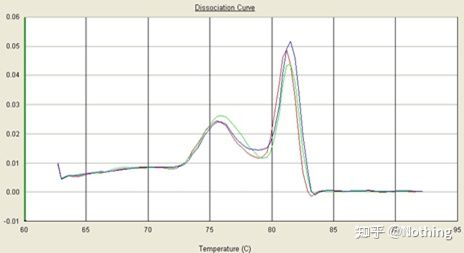
Here, we focus on the analysis of non-specific amplification using the method of melting curves . Generally speaking, when we design primers, the size of the product fragment is required to be in the range of 80-200bp, which makes the melting temperature of the PCR product 80-85 °C range. Therefore, if there are miscellaneous peaks, there must be other non-specific amplification products; if the peak appears below 80°C, it is generally considered to be a primer dimer; if the peak appears above 85°C, it is generally considered to be DNA contamination or more Nonspecific amplification of large fragments.
Note: Sometimes there is only a single peak at 80°C. At this time, this concept must be adhered to. It is likely that the amplification results are all primer dimers.
Normal melting curve (single peak with no non-specific amplification)
Problematic melting curve (non-specific amplification of spurious peaks)
【Case analysis】
There is a main peak, but the primer dimer is serious
The single-peak melting curve in the figure below can easily deceive your eyes, thinking it is a perfect experiment, but the result is completely wrong. At this time, we have to look at the melting temperature. The peak temperature is below 80°C, which is completely primer-dimer.
No target fragment, all primer dimers
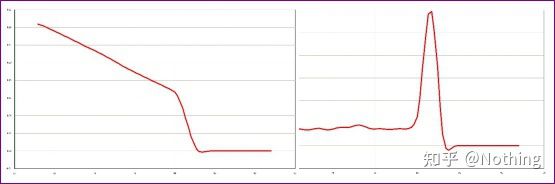
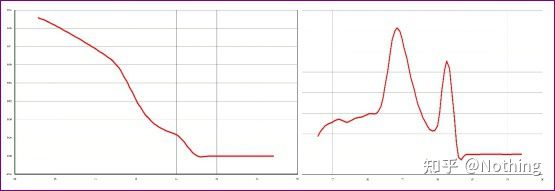
Here, my brother can’t stop. The picture below is a photo taken with a mobile phone sent to me by a scumbag. The reagents he used are all commonly used brands in the industry. He changed from one T-prefix brand to another T-prefix brand. I think you’ve already guessed it. The scumbag cried to me: “The reagent used in the first picture is too good, and the peak is single. Later, after using the reagent you recommended, it becomes like the second picture, with mixed peaks. You have made me miserable. “
Separate the two graphs. At first glance, one has a single peak, and the other has a double peak. Nonsense, a single peak is of course fine. Is that true?
Worse than Dou E, if I put the two pictures in the picture below, you will understand immediately. In fact, we are easily paralyzed by this kind of picture. After careful analysis, we found that: the peak of the first figure is at 75°C, which is completely primer dimer; the peak of the second figure appears at 75°C and 82°C, at least there are The product appears.
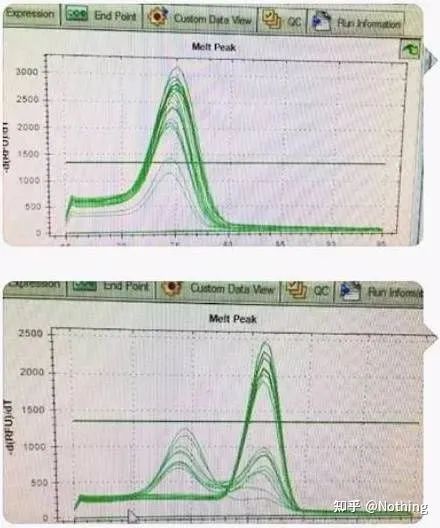
Pictures of feedback from students
So the fundamental problem is not the problem of reagents, but the problem of primer design. At the same time, it also proves that some big brands are not of iron quality, and it also proves what my brother said before: It is not the reagent brand that supports your article. It is your article that propped up the brand of reagents. Just imagine, if the scumbag did not change the reagents, the wrong data would be sent to the journal, and what would happen would be a tragedy.
2. Ct value of blank control
Don’t explain, if the blank control has a Ct value, isn’t it pollution? However, you still need to understand which blank control has a Ct value. If it is NTC, it means that there is foreign DNA such as reagent contamination. If it is NRT, it means that the extracted RNA has DNA contamination.
3. Standard curve
Including the slope and calculation formula, the PCR efficiency can be calculated through the formula. A perfect experiment requires the slope of the standard curve to approach 3.32, and R² to approach 0.9999.
4. Linear dynamic range
The dynamic range of the reaction is linear. According to the template used to generate the standard curve, the dynamic range should include at least 5 concentration gradients, and pay attention to the change of Ct values at high concentration gradients and low concentration gradients.
5. Detection accuracy
Changes in qPCR results, that is, poor repeatability, that is, poor precision, are caused by many factors, including temperature, concentration, and operation. qPCR precision generally becomes less controllable as copy number decreases. Ideally within-experimental variation, this technical variation should be distinct from biological variation, and biological replicates can directly address statistical differences in qPCR results between groups or treatments. In particular for diagnostic assays, the best inter-assay precision (repeatability) across sites and operators must be reported.
6. Detection efficiency and LOD (in multiplex qPCR)
LOD is the lowest concentration of 95% of positive samples detected. In other words, the concentration of LOD contained within a set of target gene replicates should not exceed 5% of the failed reactions. When doing multiplex qPCR analysis, especially for simultaneous detection of point mutations or polymorphisms, multiplex qPCR needs to provide evidence that the accuracy of multiple target fragments is not compromised in the same tube, multiple detection and single tube detection Efficiency and LOD should be the same. Especially when high-concentration target genes and low-concentration target genes are simultaneously amplified, this problem must be paid attention to.
Problems and solutions Generally speaking, the problems often encountered in qPCR debugging focus on the following aspects:
·nonspecific amplification
·Difficult choice of primer concentration and trouble with primer-dimers
·The annealing temperature is inaccurate
·Secondary structure affects amplification efficiency
nonspecific amplification
non-specific amplification occurs , it is generally considered whether the primer design is not suitable, but if you are not in a hurry to change the primers, you can try the following methods first (the principle is also attached):
·Increase the annealing temperature – try to make weak hydrogen bonds unable to maintain;
·Shorten annealing and elongation time – reduce the chance of weak hydrogen bonds;
·Reduce primer concentration – reduce the chance of binding of redundant primers and non-target regions;
Low amplification efficiency
The opposite situation to non-specific amplification – low amplification efficiency , and the measures to deal with low amplification efficiency are just the opposite:
·Prolong the annealing and elongation time;
·Change to three-step PCR and reduce the annealing temperature;
·Increase the primer concentration;
Ps: Many graduate students born in the 90s are unwilling to study how to debug experiments, and hope that the kit can completely solve the problem (if you want to go to a reagent company to do research and development after graduation), in fact, the reagent manufacturers also think this way, I hope it is a fool It can be used when you get it, so reagent manufacturers have spent a lot of effort to solve the problem of non-specific amplification, including the introduction of weak H-bond absorption factors. To easily solve the problem, fools still have to read the introduction of the reagent company to see if there is a factor that absorbs weak hydrogen bonds.
Difficult choice of primer concentration and trouble with primer-dimers
Method 1 : Generally speaking, the kit instructions for qPCR have recommended systems and recommended primer concentrations.
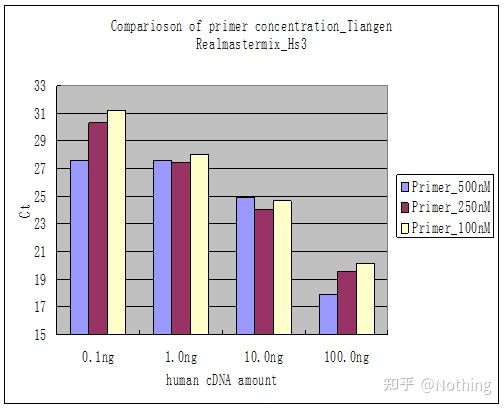
Method 2 : Debugging by setting the primer concentration gradient. The picture below is stolen from a company to illustrate. The figure below shows the fluorescence quantitative results made with three primer concentration gradients (100nM, 250nM, 500nM) and four template concentration gradients (0.1ng, 1ng, 10ng, 100ng). The Ct value of the experimental results is plotted as follows:
Primer Concentration Selection Concatenate each primer concentration into a line as follows:
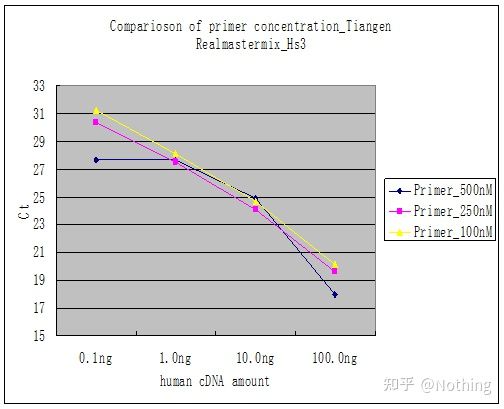
The choice of primer concentration is obvious, the linear relationship of the primer concentration of 100nM and 250nM is better, and the linear relationship of the primer concentration of 500nM is relatively poor. In 100nM and 250nM, the Ct value of 250nM is relatively small, so the optimal primer concentration is 250nM. Generally severe primer-dimers can be seen in the melting curve. What if the designed primers cannot avoid primer-dimers?
Method 3 : Reduce the amount of primers and increase the annealing temperature (no need to explain).
The empirical value of the annealing temperature is 60°C. If you are not sure, how to select a more suitable annealing temperature? The answer is the same as the choice of primer concentration – gradient test . Take a picture from Bio-rad company to illustrate the problem. For the amplification of a certain target fragment, set eight temperature gradients, each with three repetitions, and the obtained amplification curve is as follows:
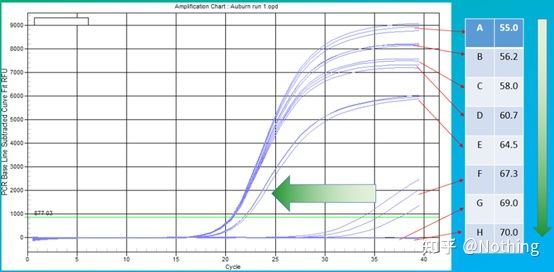
annealing temperature selection :
·70°C, 69°C—Basically, the primers cannot be combined, so there is no amplification.
·67.3°C – There is a small amount of amplification at the beginning, and the Ct value is relatively large.
·64.5°C——The Ct value decreases.
·At 60.7°C, 58.0°C, 56.2°C, and 55.0°C, the Ct values basically tended to be stable, but the final fluorescence values were different.
How to choose? Principle: The first principle is the higher Ct value. For the same Ct value, choose a higher annealing temperature to avoid dimerization and non-specific amplification. Although there is a higher fluorescence value at 55°C, there may be dimers or non-specific amplification in it.
But if you are as smart as you, you will definitely think: Logically speaking, if the PCR reaction is very specific, as long as the primer concentration exceeds the minimum requirement, the high and low points should have no effect, just like fluorescent dyes and dNTPs. Indeed, as long as the annealing temperature is optimized properly, the effect of primer concentration on Ct value will naturally be minimized.
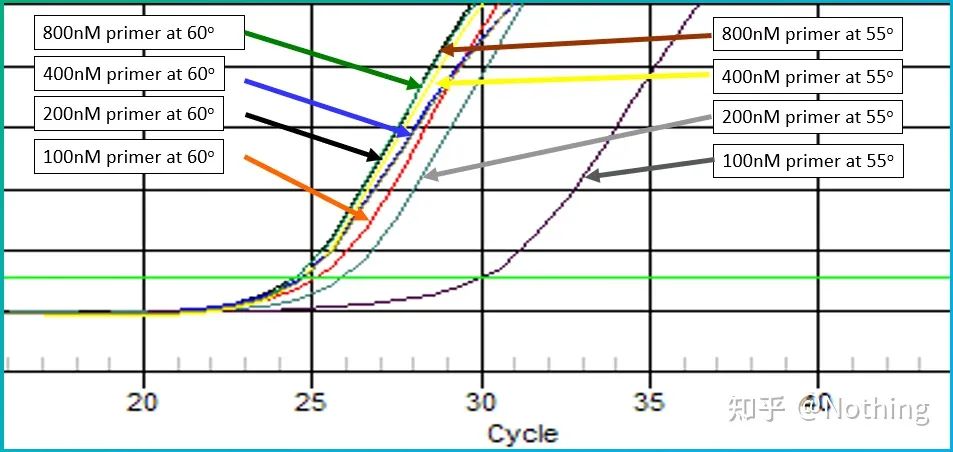
The annealing temperature is optimized properly, and the effect of primer concentration on CT will be minimized
Secondary structure affects amplification efficiency
Let’s take the picture from Bio-rad to illustrate the problem. It also designs a temperature gradient to amplify a gene with a secondary structure.
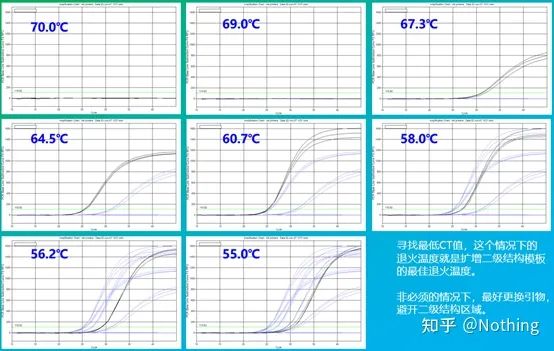
Secondary structure emerges
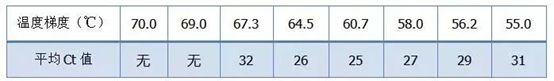
It can be seen that as the temperature gradient decreases, products begin to appear and the Ct value moves forward, reaching the minimum value at 60.7°C, and then as the temperature gradient decreases, the Ct value becomes larger. Conversely, as the temperature increases, the secondary structure opens and the amplification efficiency increases. After reaching a certain temperature, increasing the temperature cannot improve the amplification efficiency. Because the primers cannot be stably combined at this time. Therefore, look for the temperature with the lowest Ct value , which is the best temperature for amplifying the secondary structure template! Of course, smart fools must know that if it is not necessary, it is best to change the primers and avoid the secondary structure region.
5. Application level
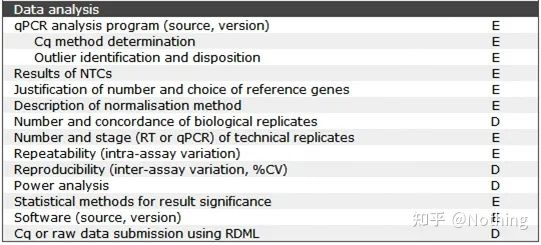
MIQE—Data Analysis
The data analysis is mainly given by the fluorescent quantitative PCR instrument. In the previous article, a lot of data analysis work has been done, such as the blank control, which has been explained in the design of the experiment. The internal reference genes, repeat numbers, etc. have been clarified. , here we mainly explain the application of qPCR.
qPCR is widely used, and experimental verification and nucleic acid diagnosis are the most commonly used scenarios.
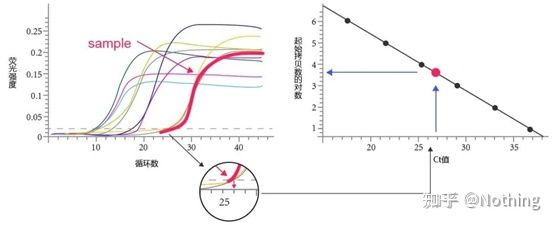
absolute quantification
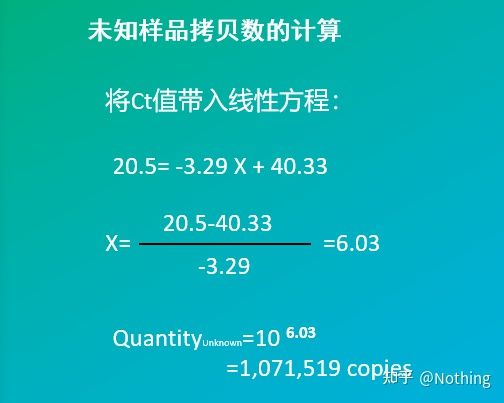
Log (initial concentration) has a linear relationship with the number of cycles. A standard curve can be drawn from a standard with known initial copy number, that is, the linear relationship of the amplification reaction can be obtained. According to the Ct value of the sample, the concentration in the sample can be calculated. The amount of templates to include.
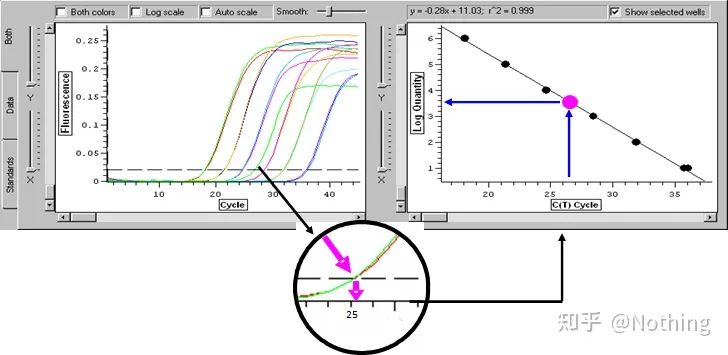
Absolute Quantitative Calculation Method
Absolute quantification must be based on the standard curve. To make a standard curve, a standard is required. Usually, the standard is a plasmid obtained by cloning the target gene. Why is it a plasmid? Because circular plasmid DNA is the most stable. Dilute the standard product in 5 to 6 gradients according to the doubling ratio (10-fold dilution), and pay attention to the uniformity when diluting. Let the Ct value fall between 15-30.
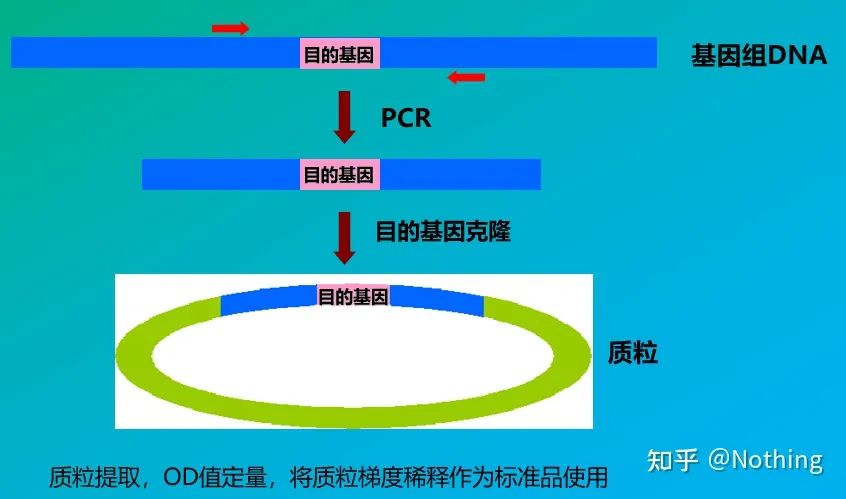
Standard preparation
At the same time, the sample to be tested should also be diluted accordingly (remember the dilution factor), and the Ct value should also fall between 15-30. The standard product + the sample to be tested are put on the machine together. After the run, a standard curve was made with the standard substance, and the samples to be tested were brought into the standard curve to calculate the concentration.
Hepatitis B virus HBV quantification is a typical absolute quantification, which can calculate the virus copy number in 1ml of blood.
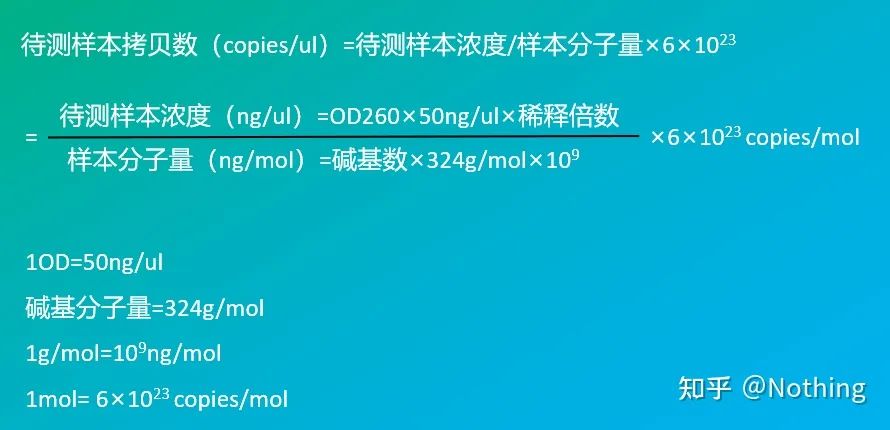
Calculation of copy number
Sample concentration to be tested (ng/ul) = OD260 × 50ug/ml × dilution factor
Sample molecular weight = number of bases × 324
The copy number of the sample to be tested (copies/ul) = the concentration of the sample to be tested / the molecular weight of the sample × 6 × 10¹⁴
Calculation method of copy number
The above is the calculation method for determining the quantity. This is a mathematical problem that can be solved after graduating from junior high school, and mathematical problems are generally solved by computers. If you don’t understand, you can come to communicate.
relative quantification
Relative quantification is mainly used in scientific research. How many viruses are there in 1ml of blood, and it is a DNA virus, this is a relatively deterministic event: the amount of blood can be determined, and the DNA virus is relatively stable. However, it is difficult for us to compare the number of transcription copies of a certain gene in a leaf, because it is difficult to determine the size, weight, and tenderness of the leaf, the amount of extracted RNA is difficult to determine, and the efficiency of reverse transcription is also difficult to determine , that is to say, any step may make the experimental data have bugs and cannot be used.
Therefore, relative quantification must introduce an element: the internal reference gene .
In other words, relative quantification is actually a comparison between the target gene and the internal reference gene. Compared in the same tissue and the same cell, the influence of sample size, RNA extraction amount, reverse transcription efficiency, and PCR efficiency is relatively small. Because of the small sample size, both internal reference genes and target genes were relatively reduced. This is why we have been emphasizing uniformity and stability before.
Internal reference genes are generally housekeeping genes ( house-keeping genes), which refer to a class of genes that are stably expressed in all cells, and their products are necessary to maintain the basic life activities of cells.
Don’t confuse this concept. Housekeeping genes are biological function terms, while internal reference genes are experimental technical terms. Housekeeping genes need to pass validation before they can be selected as internal reference genes.
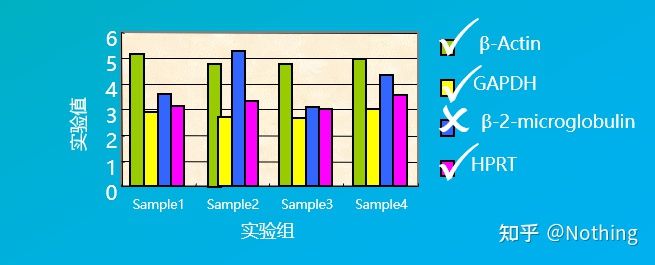
For example, we selected several housekeeping genes in the figure below to test their expression levels in different tissue cells, and found that the expression levels of β-2-microglobulin were quite different from those of the other three genes, so they could not be used as internal reference genes.
After understanding the correction function of the internal reference gene, two algorithms are derived due to the introduction of the internal reference gene.
·double standard curve method
·2 – △△Ct method (CT value comparison method)
If you are interested in studying species and gene functions, please give up the research on algorithms and use formulas directly, or use machines directly; if you are a straight guy in mathematics and engineering, please feel free.
double standard curve method
Quantify the target gene and housekeeping gene of the control sample and the sample to be tested through the standard curve, and then calculate the relative value according to the calculation formula, which is the relative expression level.
Advantages: simple analysis, relatively simple experimental optimization
Disadvantage: For each gene, each round of experiments must make a standard curve
Application: One of the two most commonly used and recognized relative quantitative methods in the study of gene expression regulation
The formula is as follows:

Examples are as follows:
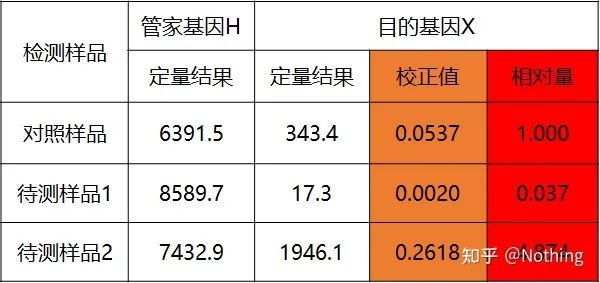
Calculate the relative amount based on the quantitative result
2 – △△Ct method (CT value comparison method)

Advantages: No need to make a standard curve
Disadvantages: It is assumed that the amplification efficiency is close to 100%; the standard deviation is < 5%, and the standard curve and the efficiency between each amplification are assumed to be consistent; the optimization of experimental conditions is more complicated.
Application: One of the two most commonly used and recognized relative quantitative methods in the study of gene expression regulation
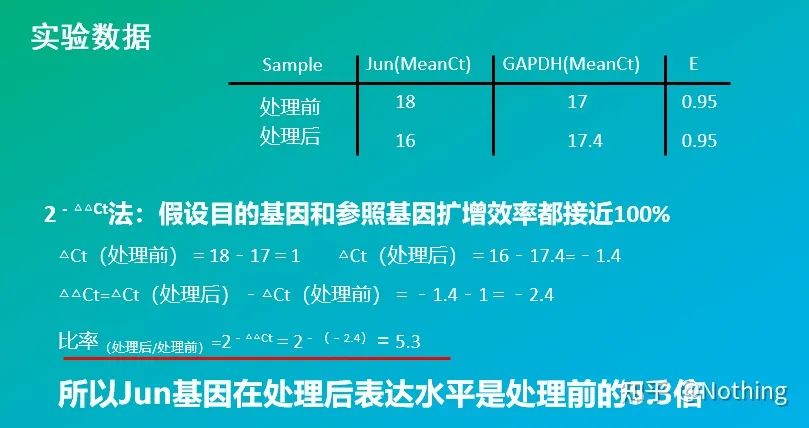
Of course, the amplification efficiency is usually impossible to be perfectly 1. Correction method: If we know that the target gene and the reference gene have the same amplification efficiency, but the amplification efficiency is not equal to 1, then 2-△△Ct can be corrected as: (1+E )-△△Ct, for example, if the amplification efficiency is 0.95, then the calculation formula can be corrected to 1.95-△△Ct
So far, the content about fluorescent quantitative PCR has come to an end .
Post time: Apr-06-2023


