


Specificity of detection
In most cases, the purpose of primer design is to maximize the specificity of PCR. This is determined by the more or less predictable influence of many variables. One important variable is the sequence at the 3′end of the primer.
Importantly, PCR assays designed for specificity are more likely to maintain high efficiency over a wide dynamic range, because the assay does not produce non-specific amplification products, thereby competing with PCR reagents or inhibiting the main amplification reaction.
Of course, in some cases, specificity is not the most important, for example, when the goal is to quantify closely related but different pathogens, special design, optimization and verification standards are required.
The melting curve is a standard method for assessing the specificity of amplicons, at least in terms of whether to amplify a single target. However, it must be emphasized that the melting curves can be misleading because, for example, they can be affected by the combined effects of suboptimal primers and low template concentrations.
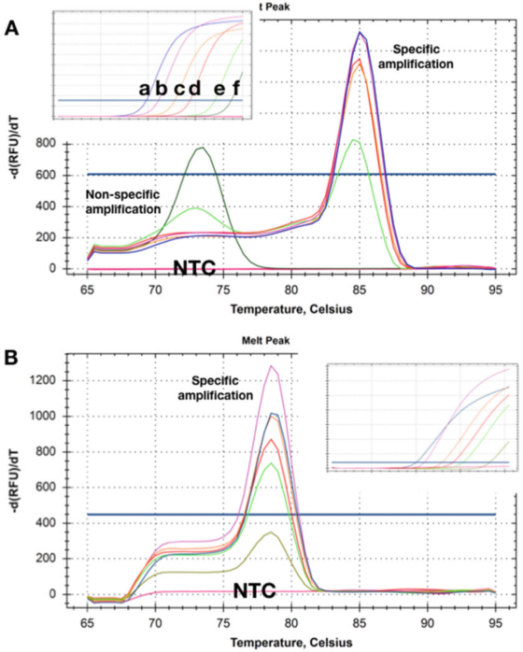
P5 | The melting curve shows the Tm shifts obtained from two detections of different amounts of two target DNAs.
A. At higher concentrations (a-d)), there is no obvious primer dimer after the qPCR measurement is completed. As the template concentration decreases to 50 copies (e), a non-specific product begins to appear and becomes the only product at the lowest concentration (f).
B. The test recorded the same Tms at all target concentrations, and there was no obvious primer dimer even at the lowest concentration (5 copies). When using these two detection methods, no amplification products were detected in NTCs.
P5 shows the dissolution curves obtained with samples in which the template is present at different concentrations. P 5a shows that at the two lowest concentrations, the Tms of the non-specific amplification products produced are lower than that of the specific amplicons.
Obviously, this detection method cannot be reliably used to detect targets that exist in low concentrations.
Interestingly, NTCs, i.e., samples with no DNA at all, did not record (non-specific) amplification products, indicating that background genomic DNA can participate in non-specific amplification/polymerization.
Sometimes such background primers and non-specific amplification cannot be remedied, but it is often possible to design a detection method that does not have non-specific amplification in any template concentration and NTC (P 5b).
Here, even recording the amplification of the target concentration with a Cq of 35 will produce a specific dissolution curve. Similarly, NTCs showed no signs of non-specific amplification. Sometimes, the detection behavior may be dependent on the mother liquor, and only non-specific amplification is detected in certain buffer compositions, which may be related to different Mg2+ concentrations.
Stability of detection
The optimization of Ta is a useful step in the empirical verification and optimization process of qPCR detection. It provides a direct indication of the robustness of the primer set by showing the temperature (or temperature range) that produces the lowest Cq without amplifying the NTC.
The two to four-fold difference in sensitivity may not be important for people with high mRNA expression, but for diagnostic tests, it may mean the difference between positive and false negative results.
The Ta properties of qPCR primers may vary greatly. Some tests are not very robust, and if they are not performed under the optimal Ta value of the primers, they will quickly collapse.
This is important because this type of detection is often problematic in the real world, and the purity of the sample, the concentration of DNA, or the presence of other DNA may not be optimal.
In addition, the target copy number may vary in a wide range, and the reagents, plastic utensils, or instruments may be different from those used when setting up the test.
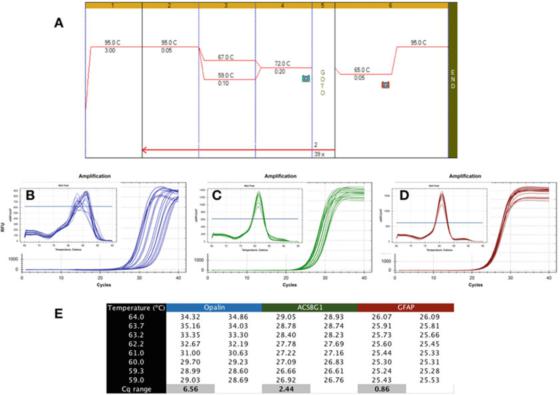
P 6|The temperature gradient shows the different robustness of PCR detection.
A. Use Bioline’s Sensifast SYBR mastermix (catalog number BIO-98050) to perform PCR on cDNA prepared from human brain RNA.
B. Use Bio-Rad’s CFX qPCR instrument to record the amplification map and dissolution curve of apalene (NM_033207, F: GCCATGGAGGAAAGTGACAGACC, R: CTCATGTGTGGGTGATCTCCTAGG).
C. Amplification graph and melting curve of ACSBG1 (NM_015162.4, F: CTACACTTCCGGCACCACTGG, R: GTCCACGTGATATTGTCTTGACTCAG).
D. Amplification graph and dissolution curve of GFAP (NM_002055.5, F: TGGAGAGGAAGATTGAGTCGCTGG, R: CGAACCTCCTCCTCGTGGATCTTC).
E. Cqs recorded at different annealing temperatures, showing the difference in Cq recorded under a 7C temperature gradient.
P 6 shows a typical result of an undesirable test, where qPCR was performed using a gradient Tas between 59C and 67C (P 6a), using primers for three human brain-specific genes.
It can be seen from the amplification graph that Opalin primers are far from ideal because their optimal Ta range is very narrow (Figure 6b), that is, Cqs are widely dispersed, resulting in Cqs being significantly compared to their optimal Cqs Low.
This detection method is unstable and may lead to suboptimal amplification. Therefore, this pair of primers should be redesigned. In addition, the melting curve analysis (inset) shows that the specificity of this detection method may also be problematic, because the melting curve of each Ta is different.
The ACSBG1 detection method shown in P 6c is more robust than the Opalin detection method above, but it is still far from ideal, and it is likely that it can be improved.
However, we emphasize that there is no necessary connection between robustness and specificity, because the dissolution curve produced by this detection method shows the same peak value in all Tas (inset).
On the other hand, the robustness test is much more tolerant, producing similar Cqs in a wide range of Tas, as in the GFAP test shown in P 6d.
The difference in Cqs obtained in the same 8 degrees Celsius range is less than 1, and the dissolution curve (inset) confirms the detection characteristics in this temperature range. It is worth noting that the calculated Tas and the actual Ta range may be very different.
There are many guidelines designed to help researchers design efficient primers, most of which are based on long-established rules and a lot of attention has been paid to the 3′end of the primers. It is often recommended to include a G or C at the 3’ end and two G or C bases (GC clamp), but no more than two of the last 5 bases.
In practice, these rules can guide researchers, but they are not necessarily correct under all circumstances.
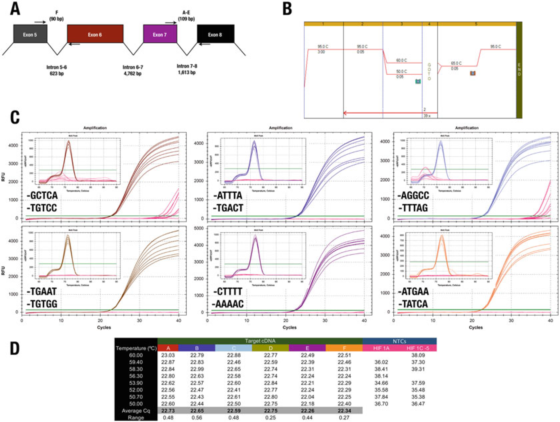
P 7 | The 3′end of the primer has little effect on specificity or efficiency.
A. The position of the primers for the human HIF-1α (NM_181054.2) gene.
B. Use Agilent Brilliant III SYBR Green mother liquor (Cat. No. 600882) to amplify six test items.
C. Amplification graph and melting curve recorded by Bio-Rad’s CFX qPCR instrument and 3′end primers. NTCs are shown in red.
D. Cqs record of each test item
For example, the result in P 7 contradicts the 3′end rule. All designs produce basically the same results, with only two primer combinations leading to non-specific amplification in NTC.
However, we cannot support the effect of the GC clip, because in this case, using A or T as a maximum of 30 bases does not reduce specificity.
Test C, where the F primer ends in GGCC, did record Cqs in NTCs, indicating that one might want to avoid these sequences at the 30-end. We emphasize that the only way to determine the best 3′end sequence of a primer pair is to evaluate some candidate primers experimentally.
Amplification efficiency
Importantly, although non-specific PCR detection can never become specific, the amplification efficiency can be adjusted and maximized in many different ways by changing the enzyme, mother liquor, additives, and cycling conditions.
To evaluate the efficiency of PCR detection, it is best to use a serial dilution of 10 or 5 times the target nucleic acid, that is, the “standard curve method”.
If PCR amplicons or synthetic DNA targets are used to generate a standard curve, serial dilutions of these targets should be mixed with a constant amount of background DNA (such as genomic DNA).
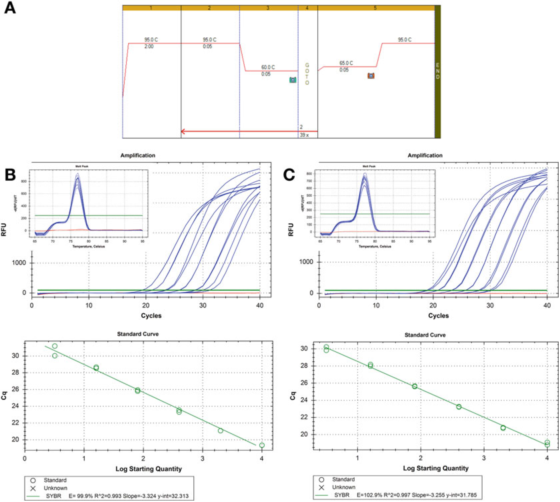
P 8 | Dilution curve to evaluate the efficiency of PCR.
A. Use primers for HIF-1: F: AAGAACTTTTAGGCCGCTCA and R: TGTCCTGTGGTGACTTGTCC and Agilent’s Brilliant III SYBR Green mastermix (catalog number 600882) for PCR and melting curve conditions.
B. 100 ng RNA was reverse transcribed, diluted 2 times, and serially diluted cDNA samples were diluted 5 times to 1 ng human genomic DNA. The melting curve is shown in the inset.
C. The RT reaction, dilution, and serial dilution were repeated for the second cDNA sample, and the results were similar.
P 8 shows two standard curves, using the same detection method on two different cDNA samples, the result is the same efficiency, about 100%, and the R2 value is also similar, that is, the degree of fit between the experimental data and the regression line or the data Degree of linearity.
The two standard curves are comparable, but not exactly the same. If the purpose is to accurately quantify the target, it must be noted that it is unacceptable to provide a copy number calculation without explaining the uncertainty

P 9 | Measurement uncertainty associated with quantification using a standard curve.
A. Use primers for GAPDH (NM_002046) to perform PCR and melting curve conditions. F: ACAGTTGCCATGTAGACC and R: TAACTGGTTGAGCACAGG and Bioline’s Sensifast SYBR mastermix (catalog number BIO-98050).
B. Amplification chart, melting curve and standard curve recorded with Bio-Rad’s CFX qPCR instrument.
C. Standard curve graph and 95% confidence interval (CI).
D. The copy number and 95% confidence interval of the three Cq values derived from the dilution curve.
P 9 shows that for an optimized test, the inherent variability of a single standard curve is approximately 2 times (95% confidence interval, minimum to maximum), which may be the smallest variability that can be expected.
Related product:
Post time: Sep-30-2021


