


RT-qPCR is developed from ordinary PCR technology. It adds fluorescent chemicals (fluorescent dyes or fluorescent probes) to the traditional PCR reaction system, and detects the PCR annealing and extension process in real time according to their different luminescent mechanisms. Fluorescent signal changes in the medium are used to calculate the amount of product change in each cycle of PCR. Currently, the most common methods are fluorescent dye method and probe method.
Fluorescent dye method:
Some fluorescent dyes, such as SYBR Green Ⅰ, PicoGreen, BEBO, etc., do not emit light by themselves, but emit fluorescence after binding to the minor groove of dsDNA. Therefore, at the beginning of the PCR reaction, the machine cannot detect the fluorescent signal. When the reaction proceeds to the annealing-extension (two-step method) or extension stage (three-step method), the double strands are opened at this time, and the new DNA polymerase During strand synthesis, fluorescent molecules are combined in the dsDNA minor groove and emit fluorescence. As the number of PCR cycles increases, more and more dyes combine with dsDNA, and the fluorescent signal is also continuously enhanced. Take SYBR Green Ⅰ as an example.
Probe method:
Taqman probe is the most commonly used hydrolysis probe. There is a fluorescent group at the 5′ end of the probe, usually FAM. The probe itself is a sequence complementary to the target gene. There is a fluorescent quenching group at the 3′ end of the fluorophore. According to the principle of fluorescence resonance energy transfer (Förster resonance energy transfer, FRET), when the reporter fluorescent group (donor fluorescent molecule) and the quenching fluorescent group (acceptor fluorescent molecule) When the excitation spectrum overlaps and the distance is very close (7-10nm), the excitation of the donor molecule can induce the fluorescence of the acceptor molecule, while the autofluorescence is weakened. Therefore, at the beginning of the PCR reaction, when the probe is free and intact in the system, the reporter fluorescent group will not emit fluorescence. When annealing, the primer and probe bind to the template. During the extension stage, the polymerase continuously synthesizes new chains. DNA polymerase has 5′-3′ exonuclease activity. When reaching the probe, the DNA polymerase will hydrolyze the probe from the template, separate the reporter fluorescent group from the quencher fluorescent group, and release the fluorescent signal. Since there is a one-to-one relationship between the probe and the template, the probe method is superior to the dye method in terms of the accuracy and sensitivity of the test.
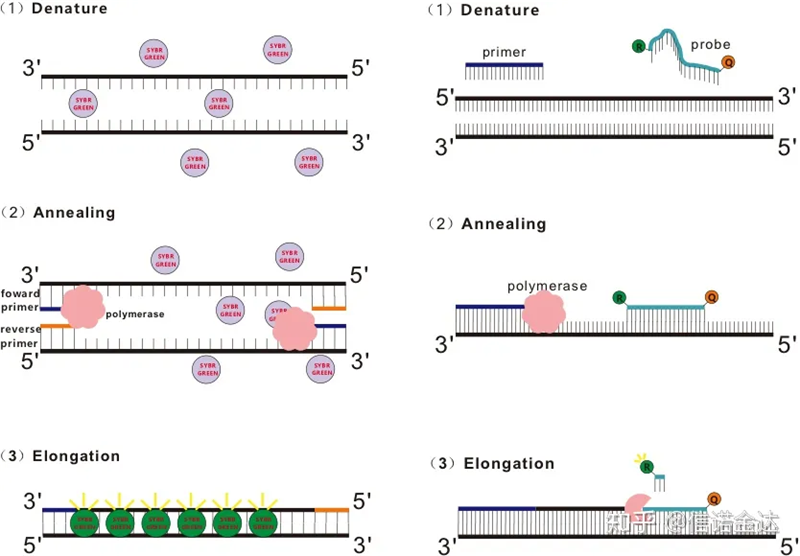
Fig 1 Principle of qRT-PCR
Primer design
Principles:
The primers should be designed in the conserved region of the nucleic acid series and have specificity.
It is best to use cDNA sequence, and mRNA sequence is also acceptable. If not, find out the cds region design of the DNA sequence.
The length of the fluorescent quantitative product is 80-150bp, the longest is 300bp, the primer length is generally between 17-25 bases, and the difference between the upstream and downstream primers should not be too large.
The G+C content is between 40% and 60%, and 45-55% is the best.
The TM value is between 58-62 degrees.
Try to avoid primer dimers and self-dimers, (do not appear more than 4 pairs of consecutive complementary bases) hairpin structure, if unavoidable, make ΔG<4.5kJ/mol* If you cannot ensure that gDNA has been removed during reverse transcription Clean, it is best to design the primers of the intron *3′ end can not be modified, and to avoid AT, GC rich regions, avoid T/C, A/G continuous structure (2-3) primers and non-
specific The homology of the heterogeneously amplified sequence is preferably less than 70% or has 8 complementary base homology.
Database:
CottonFGD search by keywords
Primer design:
IDT-qPCR primer design
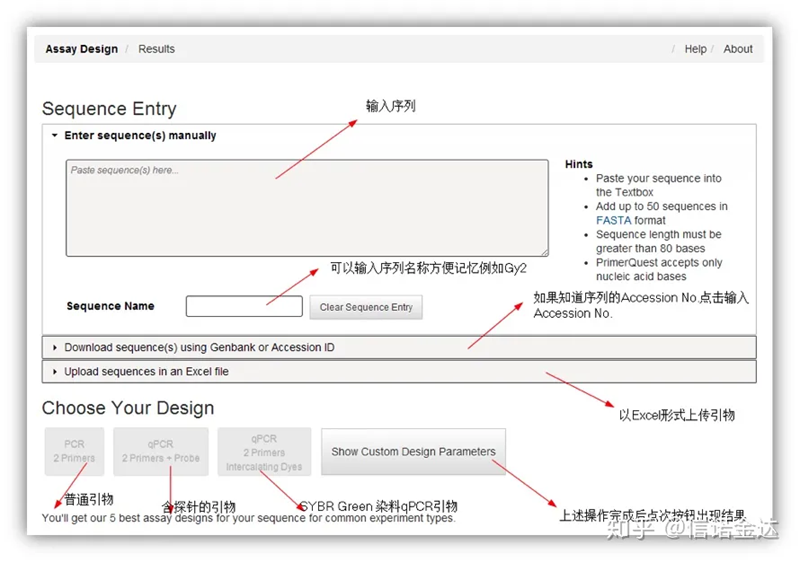
Fig2 IDT online primer design tool page
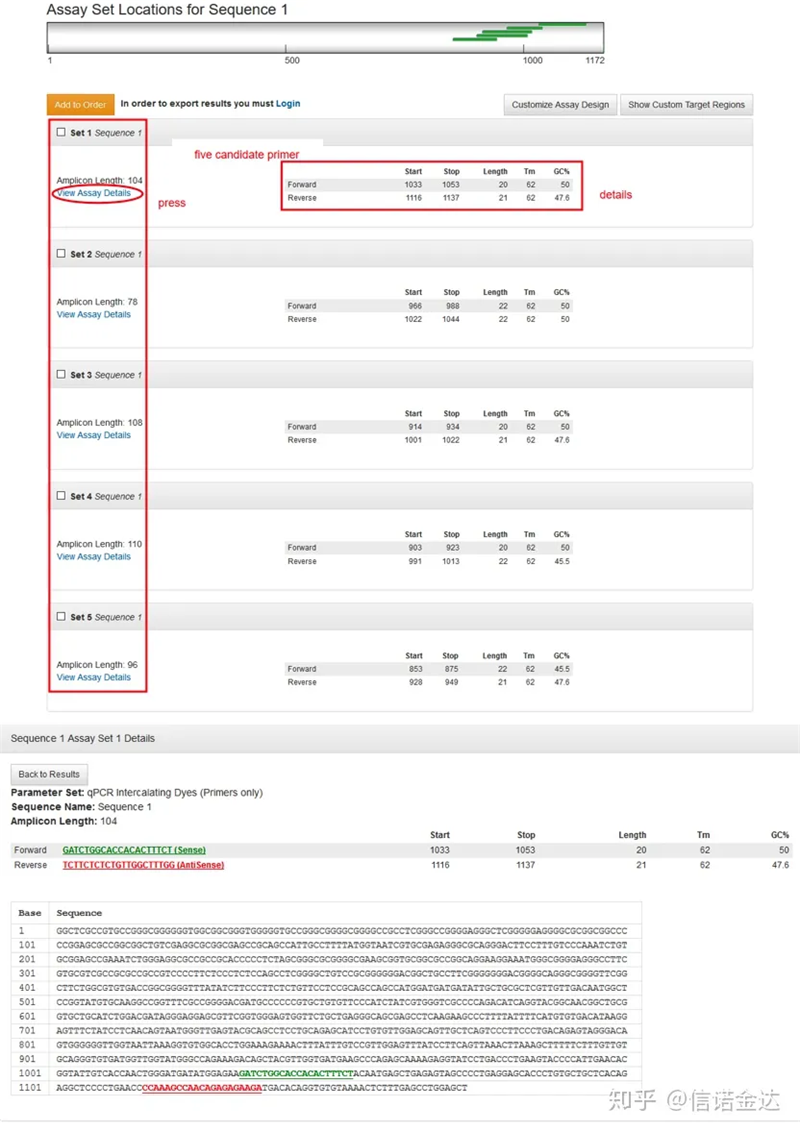
Fig3 result page display
Design of lncRNA primers:
lncRNA: the same steps as mRNA.
miRNA: The principle of the stem-loop method: Since all miRNAs are short sequences of about 23 nt, direct PCR detection cannot be performed, so the stem-loop sequence tool is used. The stem-loop sequence is a single-stranded DNA of about 50 nt, which can form a hairpin structure by itself. 3 ‘The end can be designed as a sequence complementary to the miRNA partial fragment, then the target miRNA can be connected to the stem-loop sequence during reverse transcription, and the total length can reach 70bp, which is in line with the length of the amplified product determined by qPCR. Tailing miRNA primer design .
Amplification-specific detection:
Online blast database: CottonFGD blast by sequence similarity
Local blast: Refer to using Blast+ to do local blast, linux and macos can directly establish a local database, win10 system can also be done after installing ubuntu bash. Create local blast database and local blast ; open ubuntu bash on win10 .
Notice: Upland cotton and sea island cotton are tetraploid crops, so the result of blast will often be two or more matches. In the past, using NAU cds as a database to perform blast is likely to find two homologous genes with only a few SNP differences. Usually, the two homologous genes cannot be separated by primer design, so they are treated as the same. If there is an obvious indel, the primer is usually designed on the indel, but this may lead to the secondary structure of the primer The free energy becomes higher, leading to a decrease in amplification efficiency, but this is unavoidable.
Detection of primer secondary structure:
Steps: open oligo 7 → input template sequence → close sub-window → save → locate primer on template, press ctrl+D to set primer length → analyze various secondary structures, such as self-dimerization body, heterodimer, hairpin, mismatch, etc. The last two pictures in Figure 4 are the test results of the primers. The result of the front primer is good, there is no obvious dimer and hairpin structure, no continuous complementary bases, and the absolute value of free energy is less than 4.5, while the back primer shows continuous The 6 bases are complementary, and the free energy is 8.8; in addition, a more serious dimer appears at the 3′ end, and a dimer of 4 consecutive bases appears. Although the free energy is not high, the 3′ dimer Chl can seriously affect amplification specificity and amplification efficiency. In addition, it is necessary to check for hairpins, heterodimers, and mismatches.
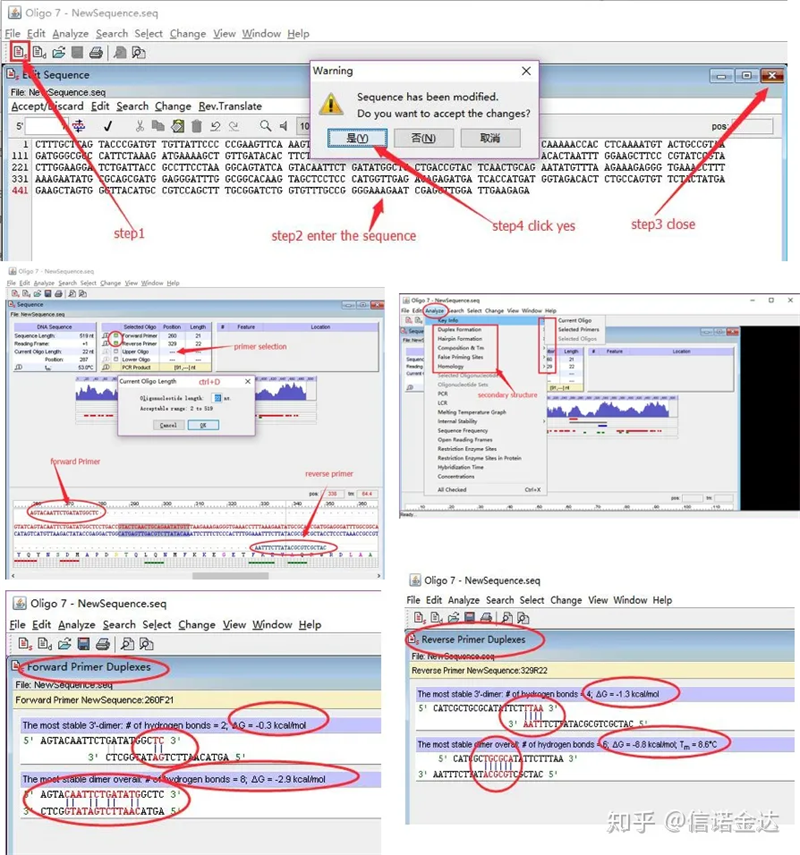
Fig3 oligo7 detection results
Amplification efficiency detection:
The amplification efficiency of the PCR reaction seriously affects the PCR results. Also in qRT-PCR, the amplification efficiency is particularly important for the quantitative results. Remove other substances, machines and protocols in the reaction buffer. The quality of the primers also has a great influence on the amplification efficiency of qRT-PCR. In order to ensure the accuracy of the results, both the relative fluorescence quantification and the absolute fluorescence quantification need to detect the amplification efficiency of the primers. It is recognized that The effective qRT-PCR amplification efficiency is between 85% and 115%. There are two methods:
1. Standard curve method:
a. Mix cDNA
b. Gradient dilution
c.qPCR
d. Linear regression equation to calculate the amplification efficiency
2. LinRegPCR
LinRegPCR is a program for the analysis of real time RT-PCR Data, also called quantitative PCR (qPCR) data based on SYBR Green or similar chemistry. The program uses non-baseline corrected data, performs a baseline correction on each sample Separately, determines a window-of-linearity and then uses linear regression analysis to fit a straight line through the PCR data set. From the slope of this line the PCR efficiency of each individual sample is calculated. The mean PCR efficiency per amplicon and the Ct value per sample are used to calculate a starting concentration per sample, expressed in arbitrary fluorescence units. Data input and output are through an Excel spreadsheet. Only sample
mixing is required, no gradient
steps are required: (Take Bole CFX96 as an example, not quite Machine with clear ABI)
experiment: it is a standard qPCR experiment.
qPCR data output: LinRegPCR can recognize two forms of output files: RDML or quantification Amplification result. In fact, it is the real-time detection value of the cycle number and fluorescence signal by the machine, and the amplification is obtained by analyzing the fluorescence change value of the linear segment efficiency.
Data selection : In theory, the RDML value should be usable. It is estimated that the problem of my computer is that the software cannot recognize RDML, so I have the excel output value as the original data. It is recommended to perform a rough screening of the data first, such as the failure of adding samples, etc. The points can be deleted in the output data (of course, you can not delete them, LinRegPCR will ignore these points in the later stage)
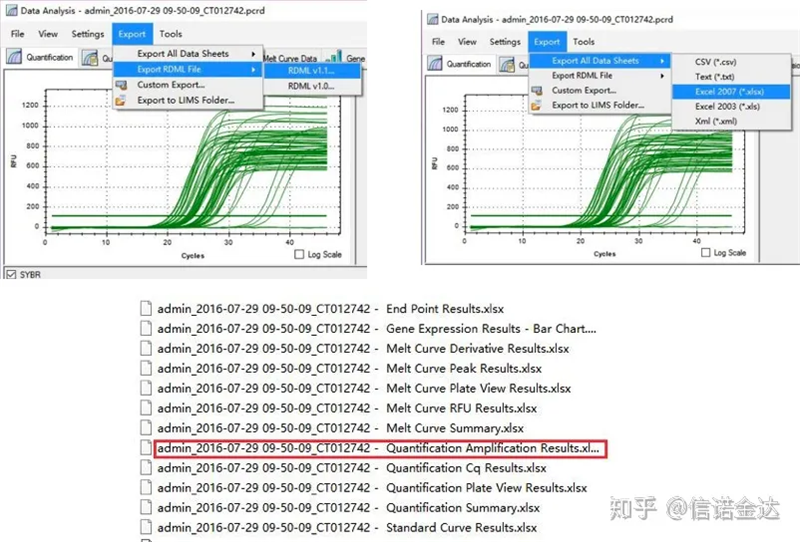
Fig5 qPCR data export
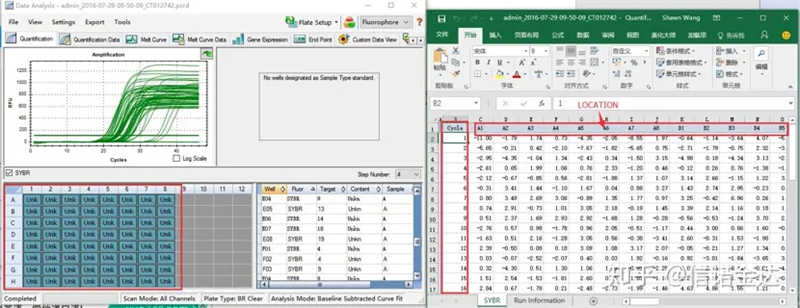
Fig6 selection of candidate samples
Data input: Open qualification amplification results.xls, → open LinRegPCR → file → read from excel → select parameters as shown in Figure 7 → OK → click determine baselines
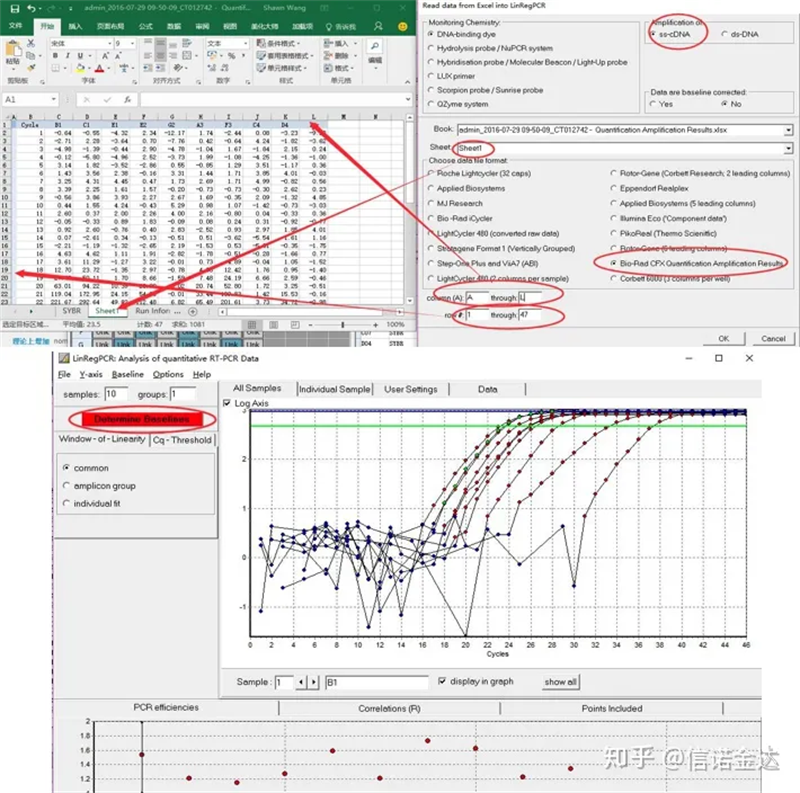
Fig7 steps of linRegPCR data input
Result: If there is no repetition, no grouping is required. If there is repetition, the grouping can be edited in the sample grouping, and the name of the gene is entered in the identifier, and then the same gene will be automatically grouped. Finally, click on the file, export excel, and view the results. The amplification efficiency and R2 results of each well will be displayed. Secondly, if you divide into groups, the corrected average amplification efficiency will be displayed. Ensure that the amplification efficiency of each primer is between 85% and 115%. If it is too large or too small, it means that the amplification efficiency of the primer is poor.
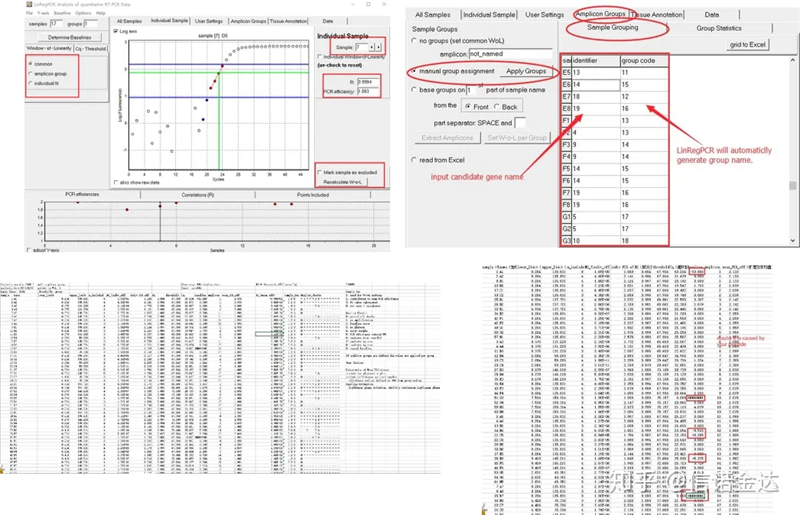
Fig 8 Result and data output
Experimental process:
RNA quality requirements:
Purity: 1.7 <OD260/OD280<2.0 (<1.7 indicates that there is protein or phenol contamination; >2.0 indicates that there may be residual isothiocyanate. Clean nucleic acid A260/A230 should be around 2 .If there is a strong absorption at 230 nm, it indicates that there are organic compounds such as phenate ions. In addition, it can be detected by 1.5% agarose gel electrophoresis. Point the marker, because the ssRNA has no denaturation and the molecular weight logarithm does not have a linear relationship, and the molecular weight cannot be correctly expressed. Concentration: Theoretically not less than 100ng/ul, if the concentration is too low, the purity is generally low not tall
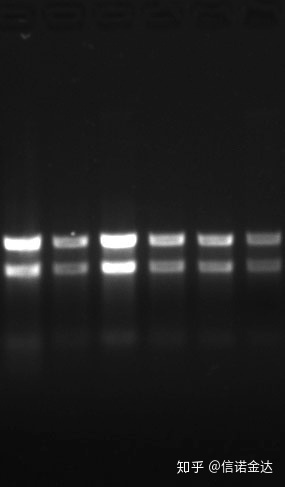
Fig9 RNA gel
In addition, if the sample is precious and the RNA concentration is high, it is recommended to aliquot it after extraction, and dilute the RNA to a final concentration of 100-300ng/ul for reverse transcription. In the process of reverse transcription , when mRNA is transcribed, oligo (dt) primers that can specifically bind to polyA tails are used for reverse transcription, while lncRNA and circRNA use random hexamer (Random 6 mer) primers for reverse transcription of total RNA For miRNA, miRNA-specific neck-loop primers are used for reverse transcription. Many companies have now launched special tailing kits. For the stem-loop method, the tailing method is more convenient, high-throughput, and reagent-saving, but The effect of distinguishing miRNAs of the same family should not be as good as the stem-loop method. Each reverse transcription kit has requirements for the concentration of gene-specific primers (stem-loops). The internal reference used for miRNA is U6. In the process of stem-loop inversion, a tube of U6 should be reversed separately, and the front and back primers of U6 should be added directly. Both circRNA and lncRNA can use HKGs as internal reference. In cDNA detection,
if there is no problem with RNA, cDNA should also be fine. However, if the perfection of the experiment is pursued, it is best to use an internal reference gene (Reference gene, RG) that can distinguish gDNA from cds. Generally, RG is a housekeeping gene. , HKG) as shown in Figure 10; At that time, I was making soybean storage protein, and used actin7 containing introns as an internal reference. The size of the amplified fragment of this primer in gDNA was 452bp, and if cDNA was used as a template, it was 142bp. Then the test results found that Part of the cDNA was actually contaminated by gDNA, and it also proved that there was no problem with the result of reverse transcription, and it could be used as a template for PCR. It is useless to run agarose gel electrophoresis directly with cDNA, and it is a diffuse band, which is not convincing.
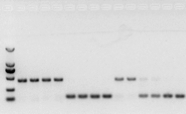
Fig 10 cDNA detection
The determination of qPCR conditions is generally no problem according to the protocol of the kit, mainly in the step of tm value. If some primers are not well designed during primer design, resulting in a large difference between the tm value and the theoretical 60°C, it is recommended that the cDNA After the samples are mixed, run a gradient PCR with primers, and try to avoid setting the temperature without bands as the TM value.
Data analysis
The conventional relative fluorescence quantitative PCR processing method is basically according to 2 -ΔΔCT . Data processing template.
Related Products:
Real Time PCR Easy TM –SYBR GREEN I
RT Easy I (Master Premix for first strand cDNA synthesis)
RT Easy II(Master Premix for first strand cDNA synthesis for qPCR)
Post time: Mar-14-2023


