


1. Basic knowledge (if you want to see the experimental part, please transfer directly to the second part)
As a derivative reaction of conventional PCR, Real time PCR mainly monitors the change of the amount of amplification product in each cycle of the PCR amplification reaction in real time through the change of the fluorescence signal, and quantitatively analyzes the starting template through the relationship between the ct value and the standard curve .
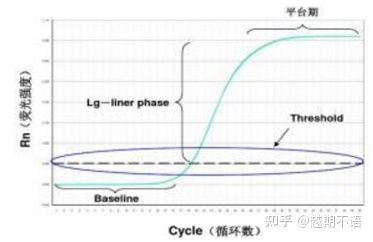
The specific data of RT-PCR are baseline , fluorescence threshold and Ct value.
| baseline: | The fluorescence value of the 3rd-15th cycle is the baseline (baseline), which is caused by the occasional error of the measurement. |
| Threshold (threshold): | Refers to the fluorescence detection limit set at an appropriate position in the exponential growth region of the amplification curve, generally 10 times the standard deviation of the baseline. |
| CT value: | It is the number of PCR cycles when the fluorescence value in each reaction tube reaches the threshold. The Ct value is inversely proportional to the amount of initial template. |
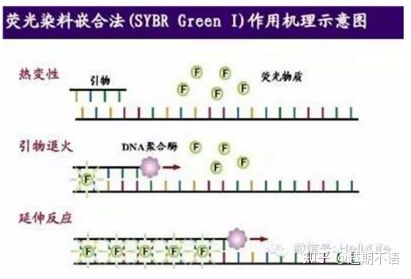
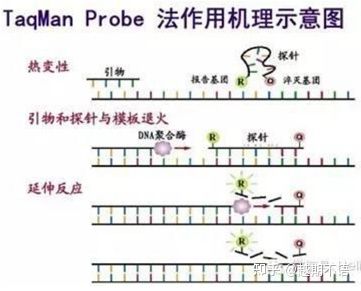
Common labeling methods for RT-PCR:
| method | advantage | shortcoming | scope of application |
| SYBR GreenⅠ | Wide applicability, sensitive, cheap and convenient | Primer requirements are high, prone to non-specific bands | It is suitable for quantitative analysis of various target genes, research on gene expression, and research on transgenic recombinant animals and plants. |
| TaqMan | Good specificity and high repeatability | The price is high and only suitable for specific goals. | Pathogen detection, drug resistance gene research, drug efficacy assessment, diagnosis of genetic diseases. |
| molecular beacon | High specificity, fluorescence, low background | The price is high, it is only suitable for a specific purpose, the design is difficult, and the price is high. | Specific gene analysis, SNP analysis |
2. Experimental steps
2.1 About the experimental grouping - there must be multiple wells in the group, and there must be biological repetitions.
| ① | Blank control | Used to detect cell growth status in experiments |
| ② | Negative control siRNA (non-specific siRNA sequence) | Demonstrate the specificity of RNAi action. siRNA may induce non-specific stress response at a concentration of 200nM. |
| ③ | Transfection Reagent Control | Exclude the toxicity of the transfection reagent to the cells or the effect on the expression of the target gene |
| ④ | siRNA against target gene | Knock down the expression of the target gene |
| ⑤ (optional) | positive siRNA | Used to troubleshoot experimental system and operational problems |
| ⑥ (optional) | Fluorescent control siRNA | The efficiency of cell transfection can be observed with a microscope |
2.2 Principles of primer design
| Amplified fragment size | Preferably at 100-150bp |
| Primer Length | 18-25bp |
| GC content | 30%-70%, preferably 45%-55% |
| Tm value | 58-60℃ |
| Sequence | Avoid T/C continuous; A/G continuous |
| 3 end sequence | Avoid GC rich or AT rich; the terminal base is preferably G or C; it is best to avoid T |
| Complementarity | Avoid complementary sequences of more than 3 bases within the primer or between two primers |
| Specificity | Use blast search to confirm primer specificity |
①SiRNA is species-specific, and the sequences of different species will be different.
②SiRNA is packaged in freeze-dried powder, which can be stored stably for 2-4 weeks at room temperature.
2.3 Tools or reagents that need to be prepared in advance
| Primer (internal reference) | Including forward and reverse two |
| Primers (target gene) | Including forward and reverse two |
| Target Si RNA (3 strips) | Generally, the company will synthesize 3 strips, and then choose one of the three by RT-PCR |
| Transfection Kit | Lipo2000 etc. |
| RNA Rapid Extraction Kit | For RNA extraction after transfection |
| Rapid Reverse Transcription Kit | for cDNA synthesis |
| PCR Amplification Kit | 2×Super SYBR Green qPCR Master Mix |
2.4 Regarding the issues that need to be paid attention to in the specific experimental steps:
①siRNA transfection process
1. For plating, you can choose 24-well plate, 12-well plate or 6-well plate (the average RNA concentration proposed in each well of a 24-well plate is about 100-300 ng/uL), and the optimal transfection density of cells is up to 60 %-80% or so
2. The transfection steps and specific requirements are strictly in accordance with the instructions.
3. After transfection, samples can be collected within 24-72 hours for mRNA detection (RT-PCR) or protein detection within 48-96 hours (WB)
② RNA extraction process
1. Prevent contamination by exogenous enzymes. It mainly includes wearing masks and gloves strictly; using sterilized pipette tips and EP tubes; the water used in the experiment must be RNase-Free.
2. It is recommended to do twice as suggested in the quick extraction kit, which will really improve the purity and yield.
3. The waste liquid must not touch the RNA column.
③ RNA quantification
After the RNA is extracted, it can be quantified directly with Nanodrop , and the minimum reading can be as low as 10ng/ul.
④Reverse transcription process
1. Due to the high sensitivity of RT-qPCR, at least 3 parallel wells should be made for each sample to prevent the subsequent Ct from being too different or the SD to be too large for statistical analysis.
2. Do not freeze and thaw Master mix repeatedly.
3. Each tube/hole must be replaced with a new tip! Do not continuously use the same pipette tip to add samples!
4. The film attached to the 96-well plate after adding the sample needs to be smoothed with a plate. It is best to centrifuge before putting it on the machine, so that the liquid on the tube wall can flow down and remove air bubbles.
⑤Common curve analysis
| No period of logarithmic growth | Possibly high concentration of template |
| No CT value | Incorrect steps for detecting fluorescent signals; degradation of primers or probes – its integrity can be detected by PAGE electrophoresis; insufficient amount of template; degradation of templates – avoiding the introduction of impurities and repeated freezing and thawing in sample preparation; |
| Ct>38 | Low amplification efficiency; PCR product is too long; various reaction components are degraded |
| Linear amplification curve | Probes may be partially degraded by repeated freeze-thaw cycles or prolonged exposure to light |
| The difference in duplicate holes is particularly large | The reaction solution is not completely melted or the reaction solution is not mixed; the thermal bath of the PCR instrument is contaminated by fluorescent substances |
2.5 About data analysis
The data analysis of qPCR can be divided into relative quantification and absolute quantification. For example, cells in the treatment group compared with cells in the control group,
How many times the mRNA of the X gene changes, this is relative quantification; in a certain number of cells, the mRNA of the X gene
How many copies there are, this is absolute quantification. Usually what we use most in the laboratory is the relative quantitative method. Usually, the 2-ΔΔct method is used the most in experiments , so only this method will be introduced in detail here.
2-ΔΔct method: The result obtained is the difference in the expression of the target gene in the experimental group relative to the target gene in the control group. It is required that the amplification efficiencies of both the target gene and the internal reference gene are close to 100%, and the relative deviation should not exceed 5%.
The calculation method is as follows:
Δct control group = ct value of target gene in control group – ct value of internal reference gene in control group
Δct experimental group = ct value of the target gene in the experimental group – ct value of the internal reference gene in the experimental group
ΔΔct=Δct experimental group-Δct control group
Finally, calculate the multiple of difference in expression level:
Change Fold=2-ΔΔct (corresponding to the excel function is POWER)
Related products:
Post time: May-20-2023


