


Verifying the performance of primers and probes in the early stage of PCR reagents and determining the most suitable reaction conditions are the prerequisites to ensure the smooth progress of formal experiments.
So how do we need to confirm the primer probe in the early stage?
The main indicators are baseline, amplification curve, ct value, amplification efficiency, low-concentration sample detection, CV, etc.
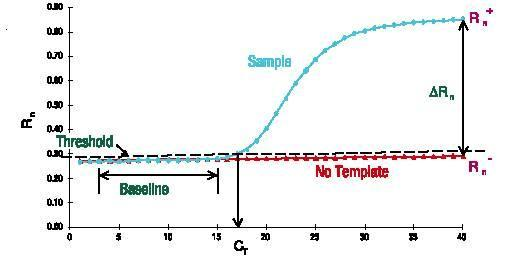
Baseline
The baseline is the horizontal line in the PCR amplification curve. In the first few cycles of the PCR amplification reaction, the fluorescence signal does not change much and forms a straight line. This straight line is the baseline.
When screening PCR primer probes, pay attention to whether the baseline is level. The purity of the primer probe concentration will affect the baseline, such as causing the baseline to rise or fall. The baseline is also a very intuitive indicator.
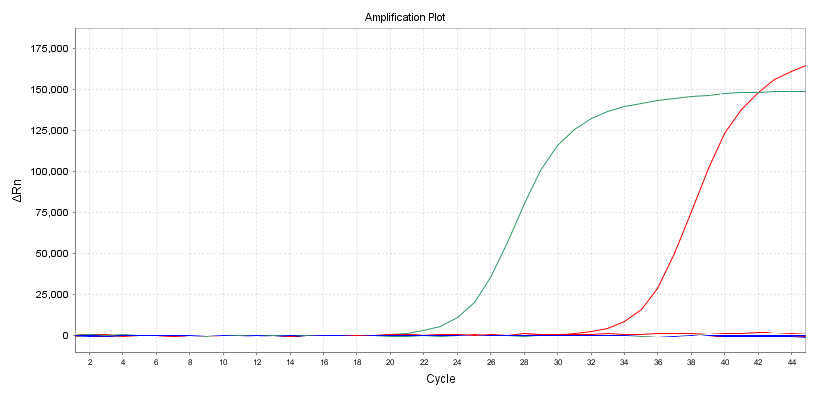
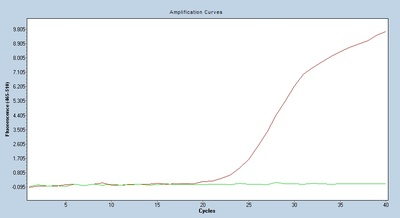
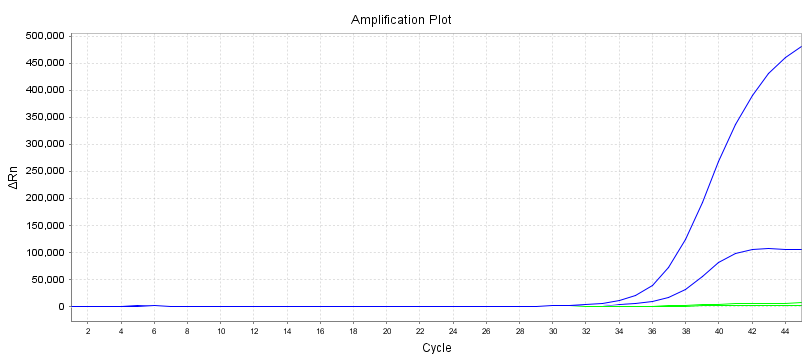
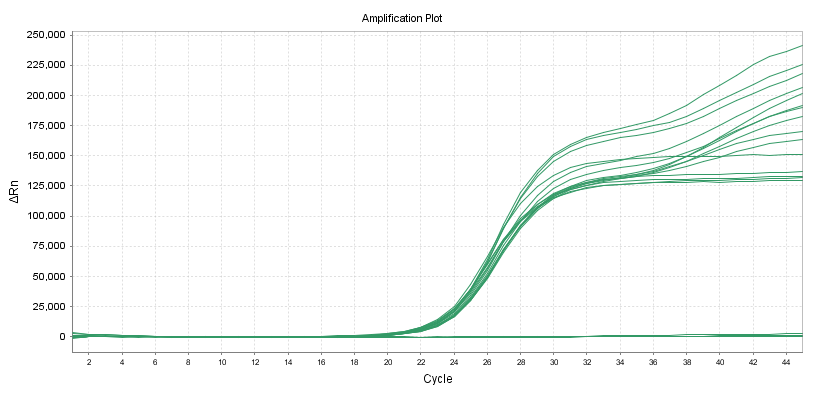
Amplification Curve
Another intuitive indicator is the shape of the amplification curve. It is best to have an S-shaped curve to avoid secondary amplification or other abnormal amplification curves.
Ct Value
The number of cycles corresponding to the inflection point from the baseline to the exponential growth is the Ct value.
For the same sample, different primer probes result in different amplification curves, and the corresponding Ct value will be affected by the amplification efficiency and interference degree. In theory, the smaller the Ct value of the primer probe we choose, the better.
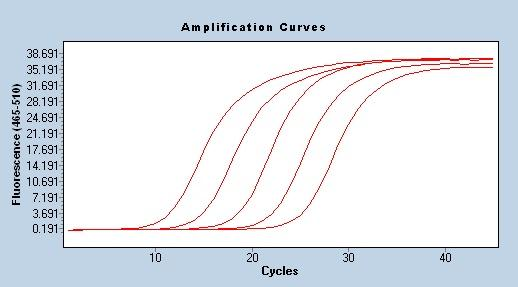
Amplification Efficiency
One of the most reliable and stable methods for evaluating PCR amplification efficiency is the standard curve, which is also widely recognized by researchers. The method involves making a series of samples to control the relative number of target templates. These samples are usually made by serial dilutions of concentrated stock solutions, the most commonly used is 10-fold dilution. Using a series of diluted samples, using standard qPCR program to amplify to obtain the Cq value, and finally draw a standard curve according to the concentration of each sample and the corresponding Cq value to obtain the linear equation Cq= -klgX0+b, and the amplification efficiency E=10(-1 /k)-1. When using qPCR for quantitative analysis, the amplification efficiency is required to be in the range of 90%-110% (3.6>k>3.1).
Low-concentration Samples Detection
When the sample concentration is low, the detection rates of different primer probes are different. We select 20 low-concentration samples to replicate, and the primer-probe system with the highest detection rate is the best.
Coefficient of Variation (CV)
10 duplicate samples can be detected with different primer probes according to the line standard of the reagent for nucleic acid amplification detection.
Quantitative Reagents:
Accuracy
The accuracy within one batch should meet: the coefficient of variation (CV,%) of the logarithmic value of the test concentration is ≤5%. When the sample concentration is low, the coefficient of variation (CV,%) of the logarithm of the detection concentration is ≤10%
Qualitative reagents:
Accuracy
The accuracy within one batch should meet:
(1) Coefficient of variation of Ct value (CV,%) ≤5%
The same sample is tested in parallel for 10 times, and the test results should be consistent
Post time: Sep-18-2021


