


It is well known that in the central dogma, RNA is the transcriptional mediator between DNA and protein expression. Compared with the detection of DNA, the detection of RNA can more objectively reflect the gene expression in organisms. Experiments involving RNA include: qRT-PCR, RNA-Seq, and fusion gene detection, etc. Based on the characteristics of RNA itself (the sugar ring of RNA has one more free hydroxyl group than the sugar ring of DNA), coupled with a large number of RNases in the environment, RNA is more unstable and easier to be degraded than DNA. Garbage in, garbage out, if the quality of RNA is not good, then the experimental results must be unsatisfactory, specifically manifested as inaccurate data or poor repeatability. Therefore, more attention should be paid to the processing of RNA, and the link of quality control is also more important to ensure the precision and accuracy of subsequent experimental data.
For the quality control of RNA, there are generally the following commonly used methods:
- Spectrophotometry
- agarose gel electrophoresis
- Agilent Bioanalyzer
- real-time fluorescent quantitative PCR
- Qubit fluorescent dye method
01 Spectrophotometry
RNA has conjugated double bonds and has an absorption peak at a wavelength of 260nm. According to Lambert-Beer’s law, we can calculate the RNA concentration from the absorption peak at 260nm. In addition, we can also calculate the purity of RNA according to the ratio of 260nm, 280nm and 230nm absorption peaks. 280nm and 230nm are the absorption peaks of proteins and small molecules, respectively. The ratio of A260/A280 and A260/A230 of qualified RNA purity should be greater than 2. If it is less than 2, it means that there is protein or small molecule contamination in the RNA sample and needs to be purified again. Contamination sources will affect downstream experiments, such as inhibiting the amplification efficiency of PCR reactions, resulting in inaccurate quantitative results. The purity of RNA has a great influence on subsequent results, so spectrophotometry is generally an indispensable quality control link in the first step in nucleic acid experiments.
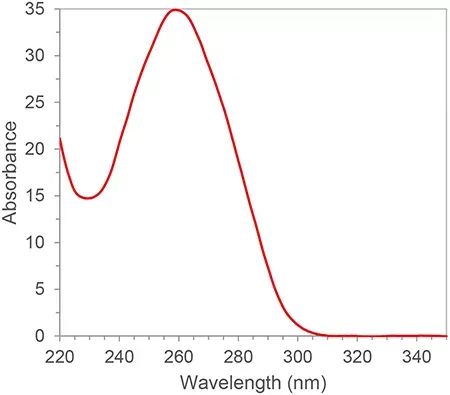
Figure 1. Typical RNA/DNA Absorption Spectrum
02 Agarose gel electrophoresis
In addition to purity, the integrity of RNA is also one of the important indicators for judging the quality of RNA. The degradation of RNA will lead to a large number of short fragments in the sample, so the number of RNA fragments that can be effectively detected and covered by the reference sequence will be reduced. RNA integrity can be checked by electrophoresis of total RNA on a 1% agarose gel. This method can configure the gel yourself, or use the prefabricated E-Gel™ System for integrity testing. More than 80% of total RNA is ribosomal RNA, the majority of which is composed of 28S and 18S rRNA (in mammalian systems). Good quality RNA will show two obvious bright bars, which are 28S and 18S bright bars, respectively, at 5 Kb and 2 Kb, and the ratio will tend to be close to 2:1. If it is in a diffuse state, it means that the RNA sample may have been degraded, and it is recommended to use the method described later to further test the quality of RNA.
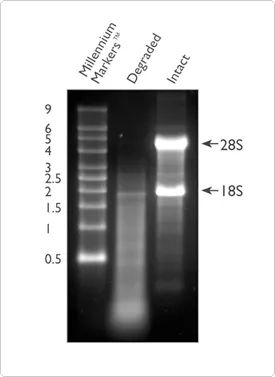
Figure 2. Comparison of degraded (lane 2) and intact RNA (lane 3) on agarose gel electrophoresis
03 Agilent Bioanalyzer
In addition to the agarose gel electrophoresis method described above, which can help us identify the integrity of RNA simply and quickly, we can also use the Agilent bioanalyzer to determine the integrity of RNA. It uses a combination of microfluidics, capillary electrophoresis, and fluorescence to assess RNA concentration and integrity. By using the built-in algorithm to analyze the profile of the RNA sample, the Agilent bioanalyzer can calculate a reference RNA integrity value, RNA Integrity Number (hereinafter referred to as RIN) [1]. The larger the value of RIN, the higher the integrity of the RNA (1 is extremely degraded, 10 is the most complete). Some experiments involving RNA suggest using RIN as a parameter for quality assessment. Taking high-throughput sequencing experiments (hereinafter referred to as NGS) as an example, the guidelines of Oncomine™ Human Immune Repertoire, which is used to detect B cell and T cell antigen receptors in Thermo Fisher’s Oncomine panel series, suggest that samples with RIN values greater than 4, More effective reads and clones can be measured (Figure 3). There are different recommended ranges for different panels, and often a higher RIN can bring more effective data.
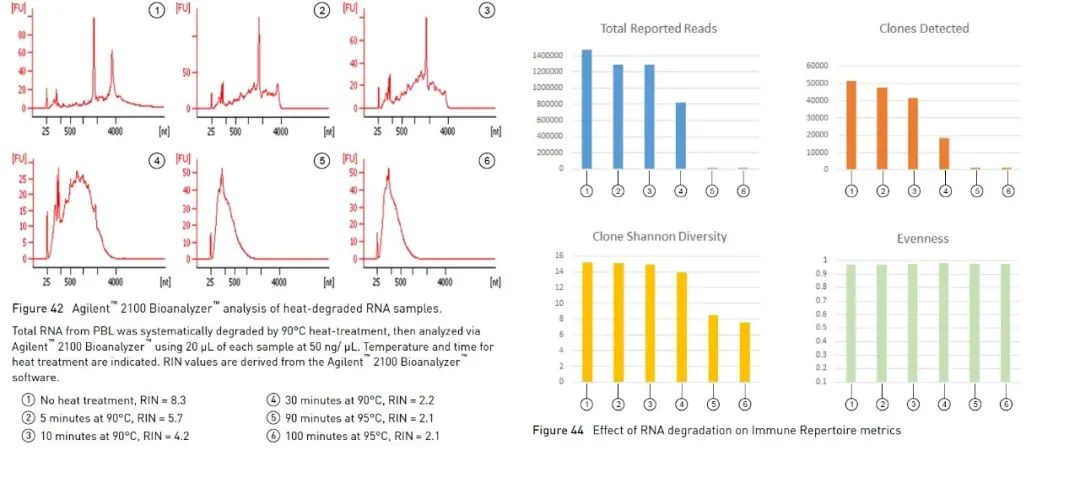
Figure 3, in Oncomine™ Human Immune Repertoire experiments, samples with RIN greater than 4 can detect more effective reads and T cell clones. 【2】
However, the RIN value also has some limitations. Although RIN has a high correlation with the quality of NGS experimental data, it is not suitable for FFPE samples. FFPE samples have been chemically treated for a long time, and the extracted RNA generally has a relatively low RIN value. However, this does not mean that the effective data of the experiment must be unsatisfactory. To accurately assess the quality of FFPE samples, we need to use measurements other than RIN. In addition to RIN, Agilent bioanalyzer can also calculate DV200 value as an evaluation parameter of RNA quality. DV200 is a parameter that calculates the proportion of fragments larger than 200 bp in an RNA sample. DV200 is a better indicator of FFPE sample quality than RIN. For the RNA extracted by FFPE, it has a very high correlation with the number of genes that can be effectively detected and the diversity of genes [3]. Although DV200 can make up for the deficiencies in the quality detection of FFPE, the Agilent bioanalyzer still cannot comprehensively analyze the quality problems in RNA samples, including whether there are inhibitors in the samples. Inhibitors themselves can affect the amplification efficiency of downstream experiments and reduce the amount of useful data. To know whether there is an inhibitor in the sample, we can adopt the real-time fluorescent quantitative PCR method described next.
04 real-time fluorescent quantitative PCR
The real-time fluorescent quantitative PCR method can not only detect the inhibitors in the sample, but also accurately reflect the quality of RNA in the FFPE sample. Compared with Agilent biological analyzers, real-time fluorescence quantitative instruments are more popular in major biological laboratories due to their wider application. To test the quality of RNA samples, we only need to purchase or prepare primer probes for internal reference genes, such as GUSB (Cat no. Hs00939627). By using this set of primers, probes and standards (total RNA of known concentration) to conduct absolute quantitative experiments, the effective RNA fragment concentration can be calculated as the evaluation standard of RNA quality (Functional RNA Quantitation (FRQ) for short). In an NGS test, we found that the FRQ of RNA samples has a very high correlation with the effective data volume. For all samples greater than 0.2ng/uL FRQ, at least 70% of the reads can effectively cover the reference sequence (Figure 4).
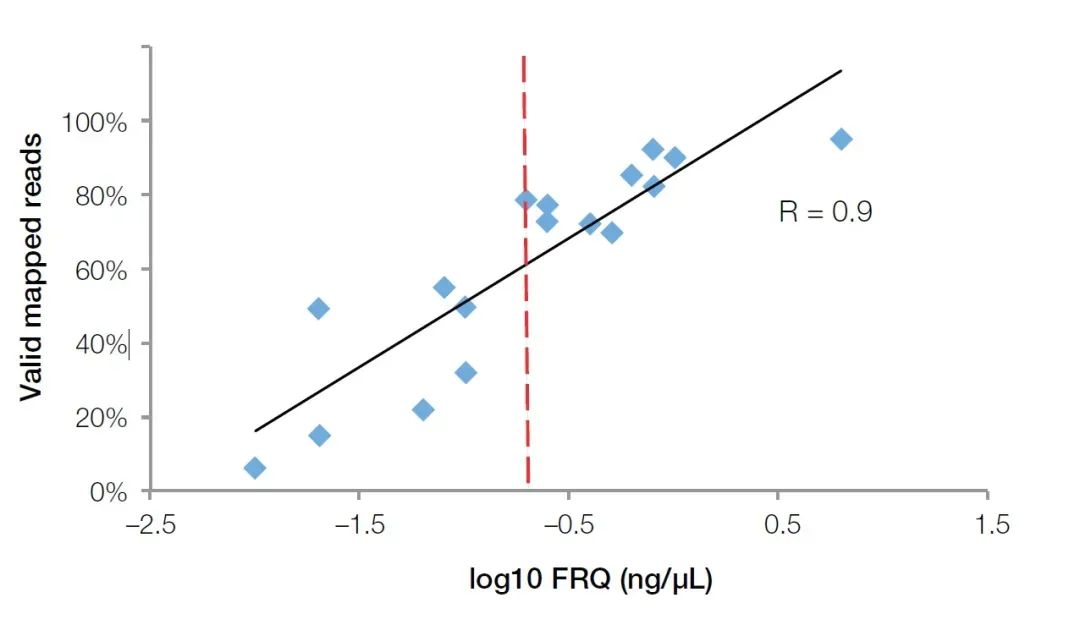
Figure 4, the FRQ value detected by the fluorescence quantitative method has a very high correlation (R2>0.9) with the effective data obtained in the NGS experiment. The red line is the FRQ value equal to 0.2 ng/uL (log10 = -0.7). 【4】
In addition to being applicable to FFPE samples, the real-time quantitative PCR method can also effectively monitor inhibitors in samples. We can add the sample to be detected into the reaction system with Internal Positive Control (IPC) and its Assay, and then perform fluorescence quantification to obtain the Ct value. If the Ct value lags behind the Ct value in the no-sample reaction, it indicates that the inhibitor is present in the sample and inhibits the amplification efficiency in the reaction.
05 Qubit fluorescent dye method
Qubit Fluorometer is the most commonly used small device for nucleic acid concentration and purity detection, which is easy to operate and exists in almost every molecular biology laboratory. It accurately calculates the concentration of nucleic acid by detecting and nucleic acid-binding fluorescent dye (Qubit detection reagent). Qubit has high sensitivity and specificity, and can accurately quantify RNA down to pg/µL concentration. In addition to the well-known ability to accurately quantify nucleic acid concentration, Thermo Fisher’s latest new model, Qubit 4.0, can also detect the integrity of RNA. Qubit 4.0′s RNA detection system (RNA IQ Assay) detects the integrity of RNA by simultaneously detecting two specific fluorescent dyes. These two fluorescent dyes can bind to large fragments and small fragments of RNA, respectively. These two fluorescent dyes indicate the proportion of large fragments of RNA in the sample, and from this the IQ (Integrity and Quality) value representing the RNA quality can be calculated. The IQ value is applicable to both FFPE and non-FFPE samples, and has a great influence on the subsequent sequencing quality. Taking NGS experiments as an example, in the RNA-Seq test experiments performed on the Ion torrent™ platform, most samples with IQ values greater than 4 had at least 50% effective reads (Figure 5). Compared with the above-mentioned detection methods, Qubit IQ Assay is not only more convenient to operate and takes less time (within five minutes), but also has a great correlation between the measured parameter IQ value and the data quality of downstream experiments.
Figure 5, there is a great correlation between the Qubit RNA IQ value and the mapped reads of RNA-Seq. 【5】
Through the above introduction, I believe that everyone has a sufficient understanding of different RNA quality control methods. In practice, you can choose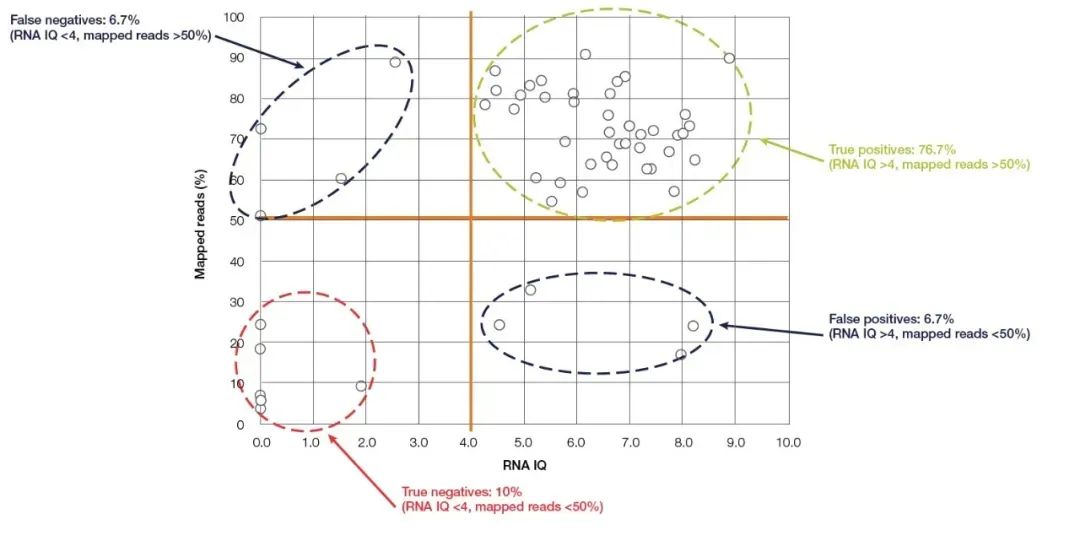 the corresponding method according to the sample type and existing instruments. Only by controlling the quality of RNA well can we avoid the failure of subsequent experiments caused by poor sample quality, thus saving precious time, energy and cost.
Reference products:
Animal Total RNA Isolation Kit
references
【1】Schroeder, A., Mueller, O., Stocker, S. et al. The RIN: an RNA integrity number for assigning integrity values to RNA measurements. BMC Molecular Biol 7, 3 (2006). https: // doi .org/10.1186/1471-21 99-7-3
【2】Oncomine Human Immune Repertoire User Guide (Pub. No. MAN0017438 Rev. C.0).
【3】Leah C Wehmas, Charles E Wood, Brian N Chorley, Carole L Yauk, Gail M Nelson, Susan D Hester, Enhanced Quality Metrics for Assessing RNA Derived From Archival Formalin-Fixed Paraffin-Embedded Tissue Samples, Toxicological Sciences, Volume 170, Issue 2, August 2019, Pages 357–373, https://doi.org/10.1093/toxsci/
Post time: Jun-12-2023


